

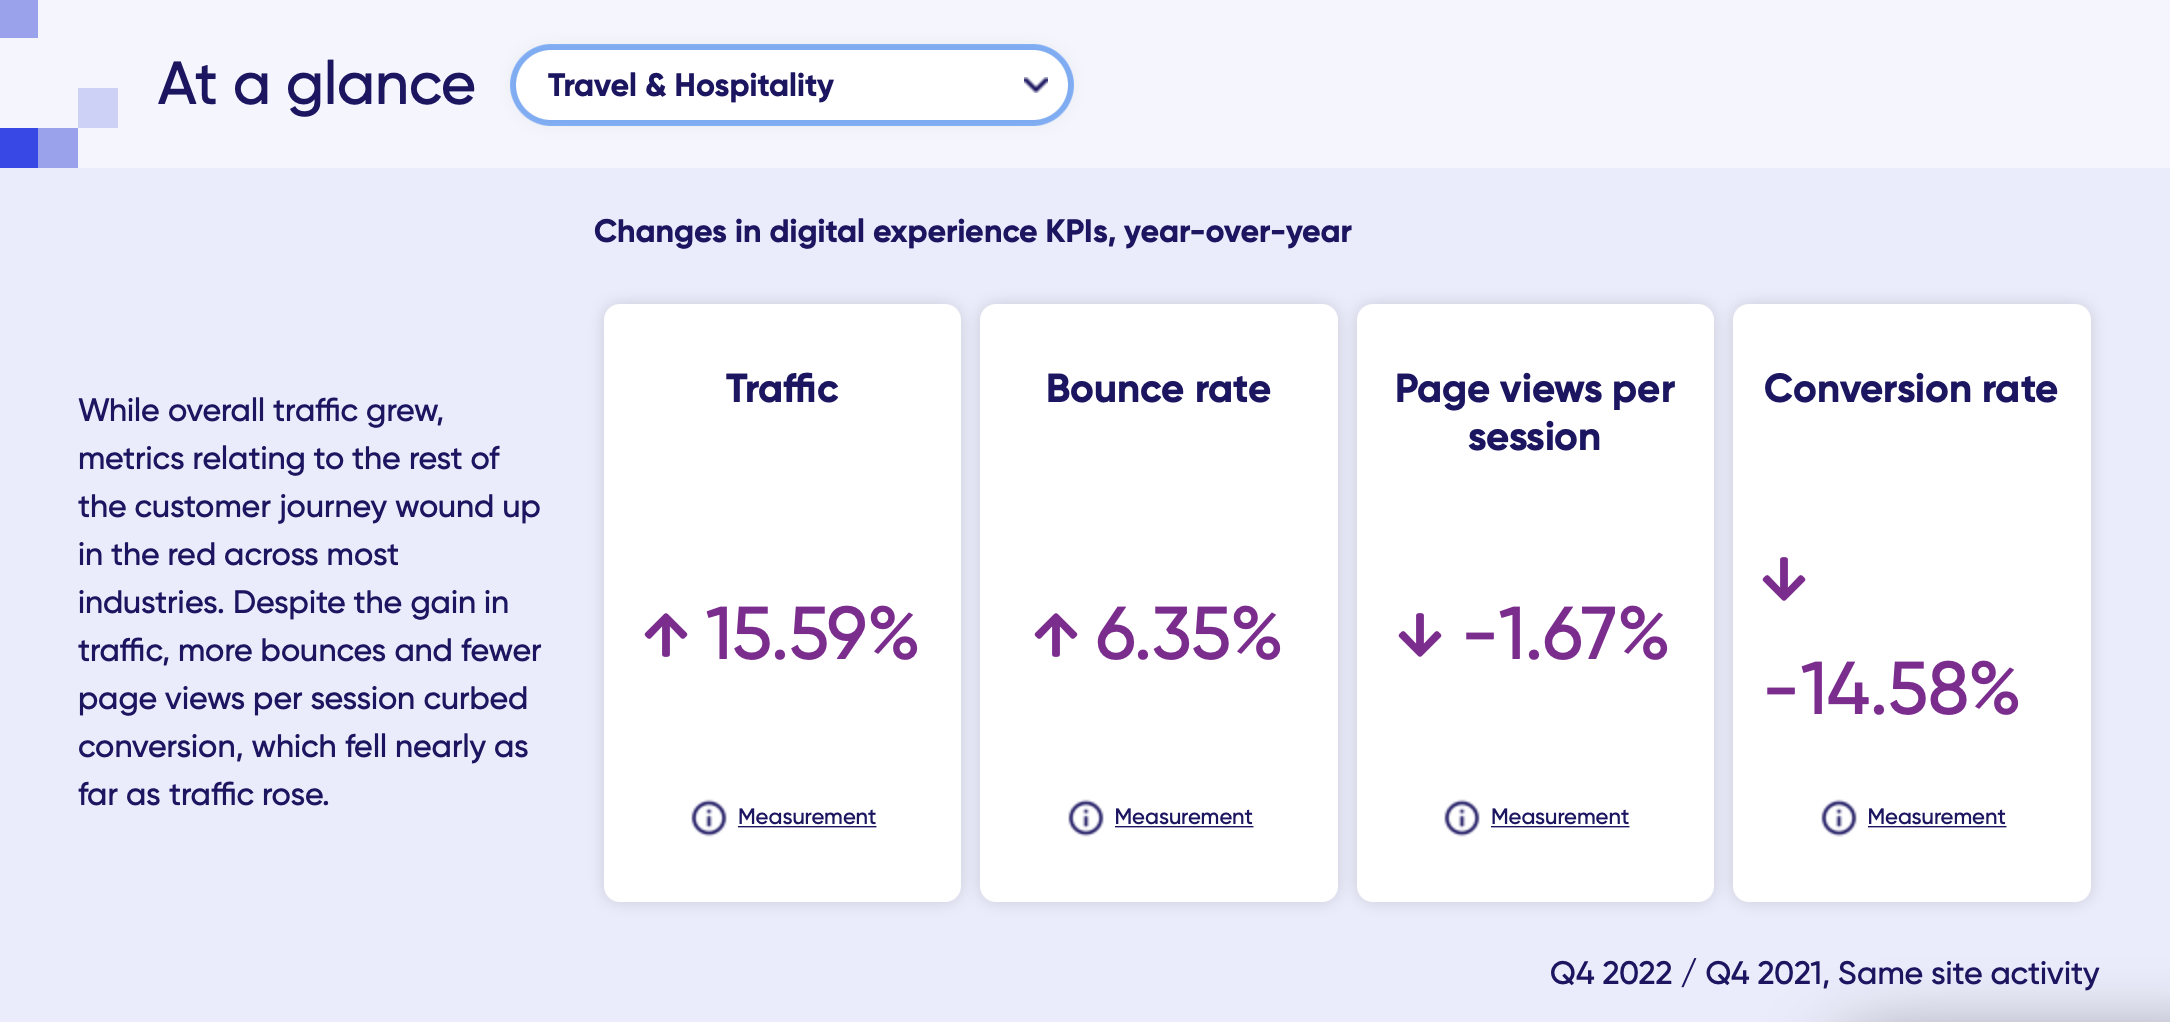
The 2023 Digital Experience Benchmark report shares the most important digital KPIs driving growth and their impact on the digital experience and customer happiness based on 35bn sessions, 161 bn page views, 2942 websites, 26 countries, 9 industries. Data below allows you to benchmark your company's performance vs. Travel & Hospitality sector data: while traffic rate increased +15%, page views per session dropped -1,6% and conversion dropped -14%.
 GLO
GLO2023 Digital Experience Benchmark Explorer includes an interactive explorer which puts the most relevant benchmarks for digital customer experience (CX) in your hands.
Key findings:
-
Greater activity unlocks more revenue (cha-ching!): Sites with higher activity (the share of time users spend interacting with content during a visit) enjoy 19% higher conversion rates and 20% lower bounce rates than sites with the lowest activity.
-
Save the session and boost revenue, with speed: Pages that load in under 1 second, compared with those that exceed 2 seconds, cut bounce rate by 5.5 percentage points (43.5% vs. 49.0%) and average 1.2 additional page views per session. These additional views help boost conversion rate by 25%.
-
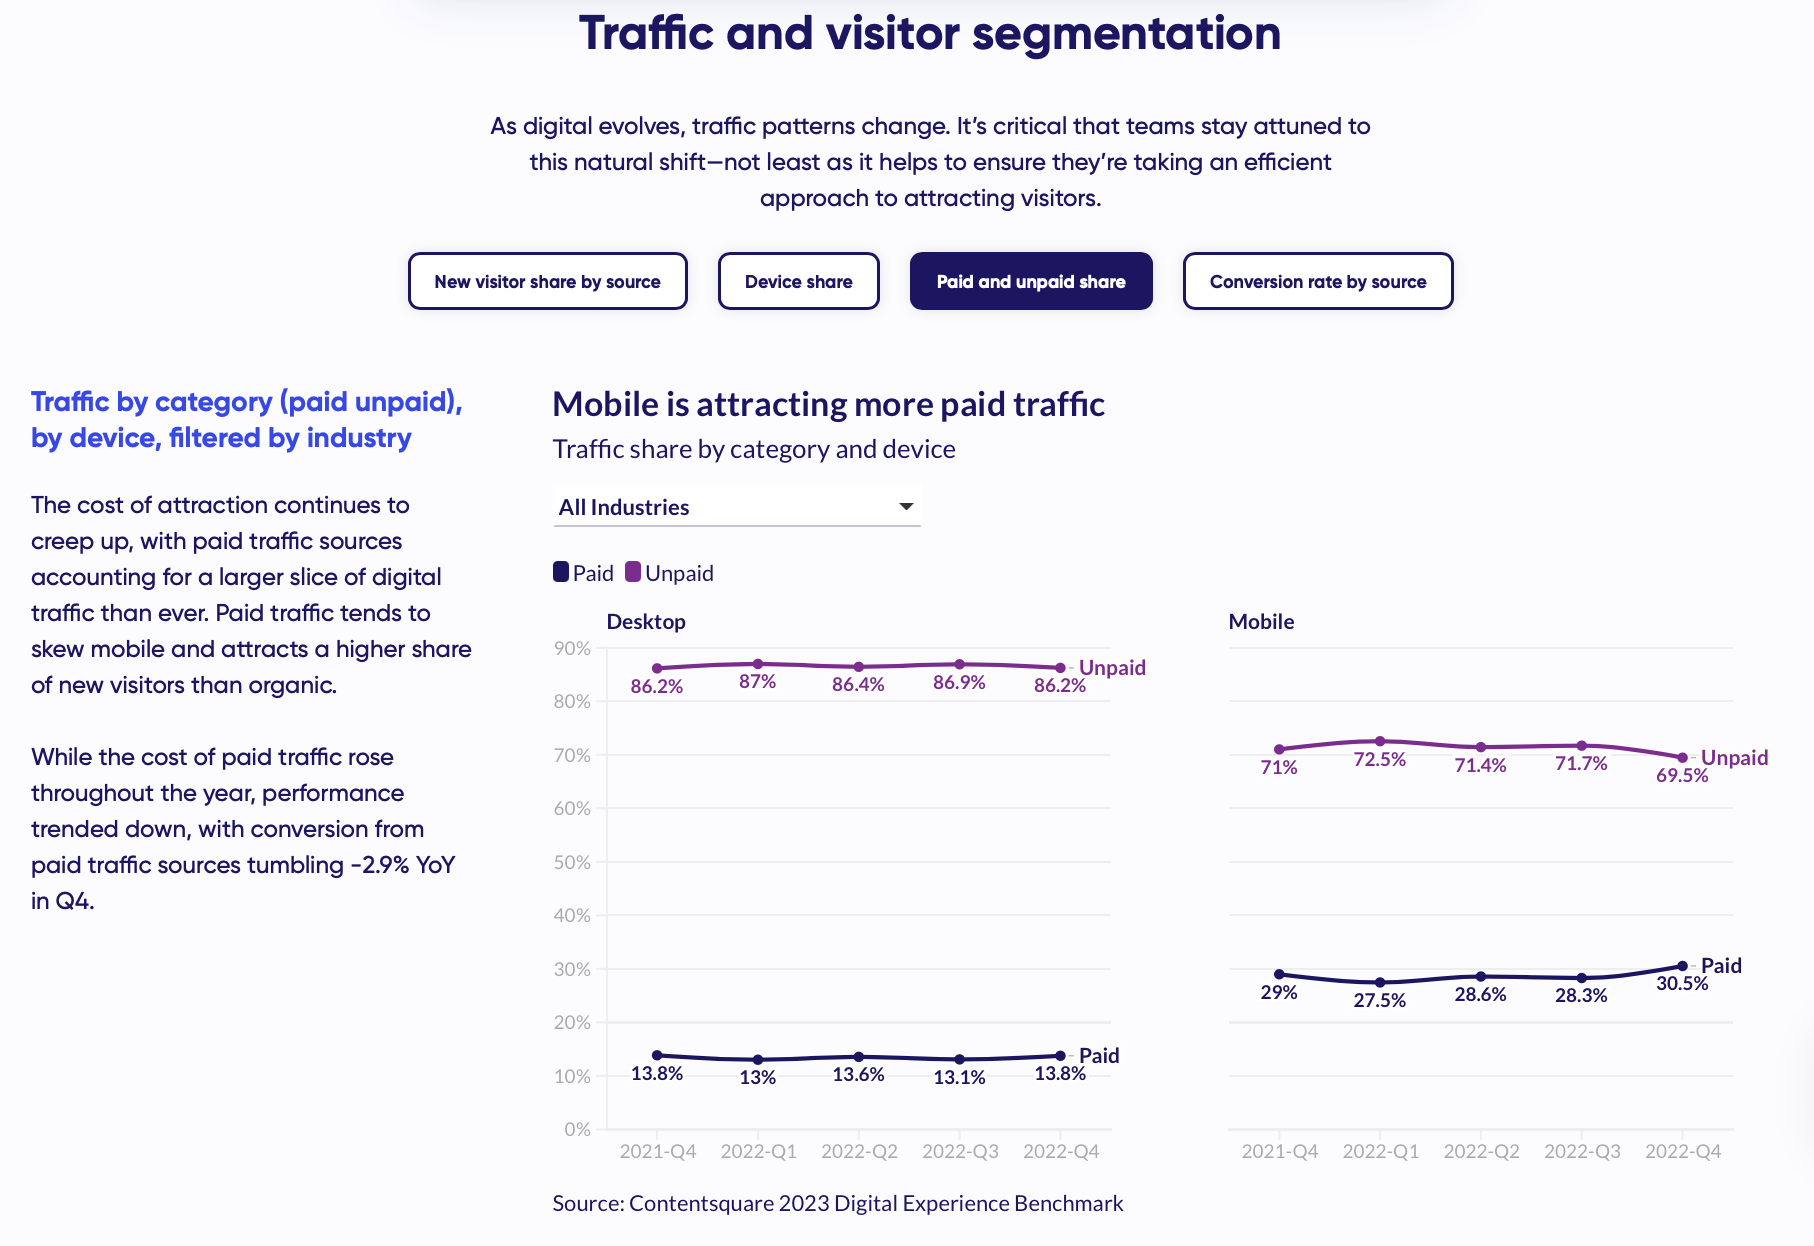
Optimize traffic—paying a premium is painful: While digital traffic trended up, rising +4.6% YoY in Q4, paid sources accounted for more of it. Paid sources drove 31% of all mobile traffic and 25% overall, though paid conversion rates fell -2.9% overall.
-
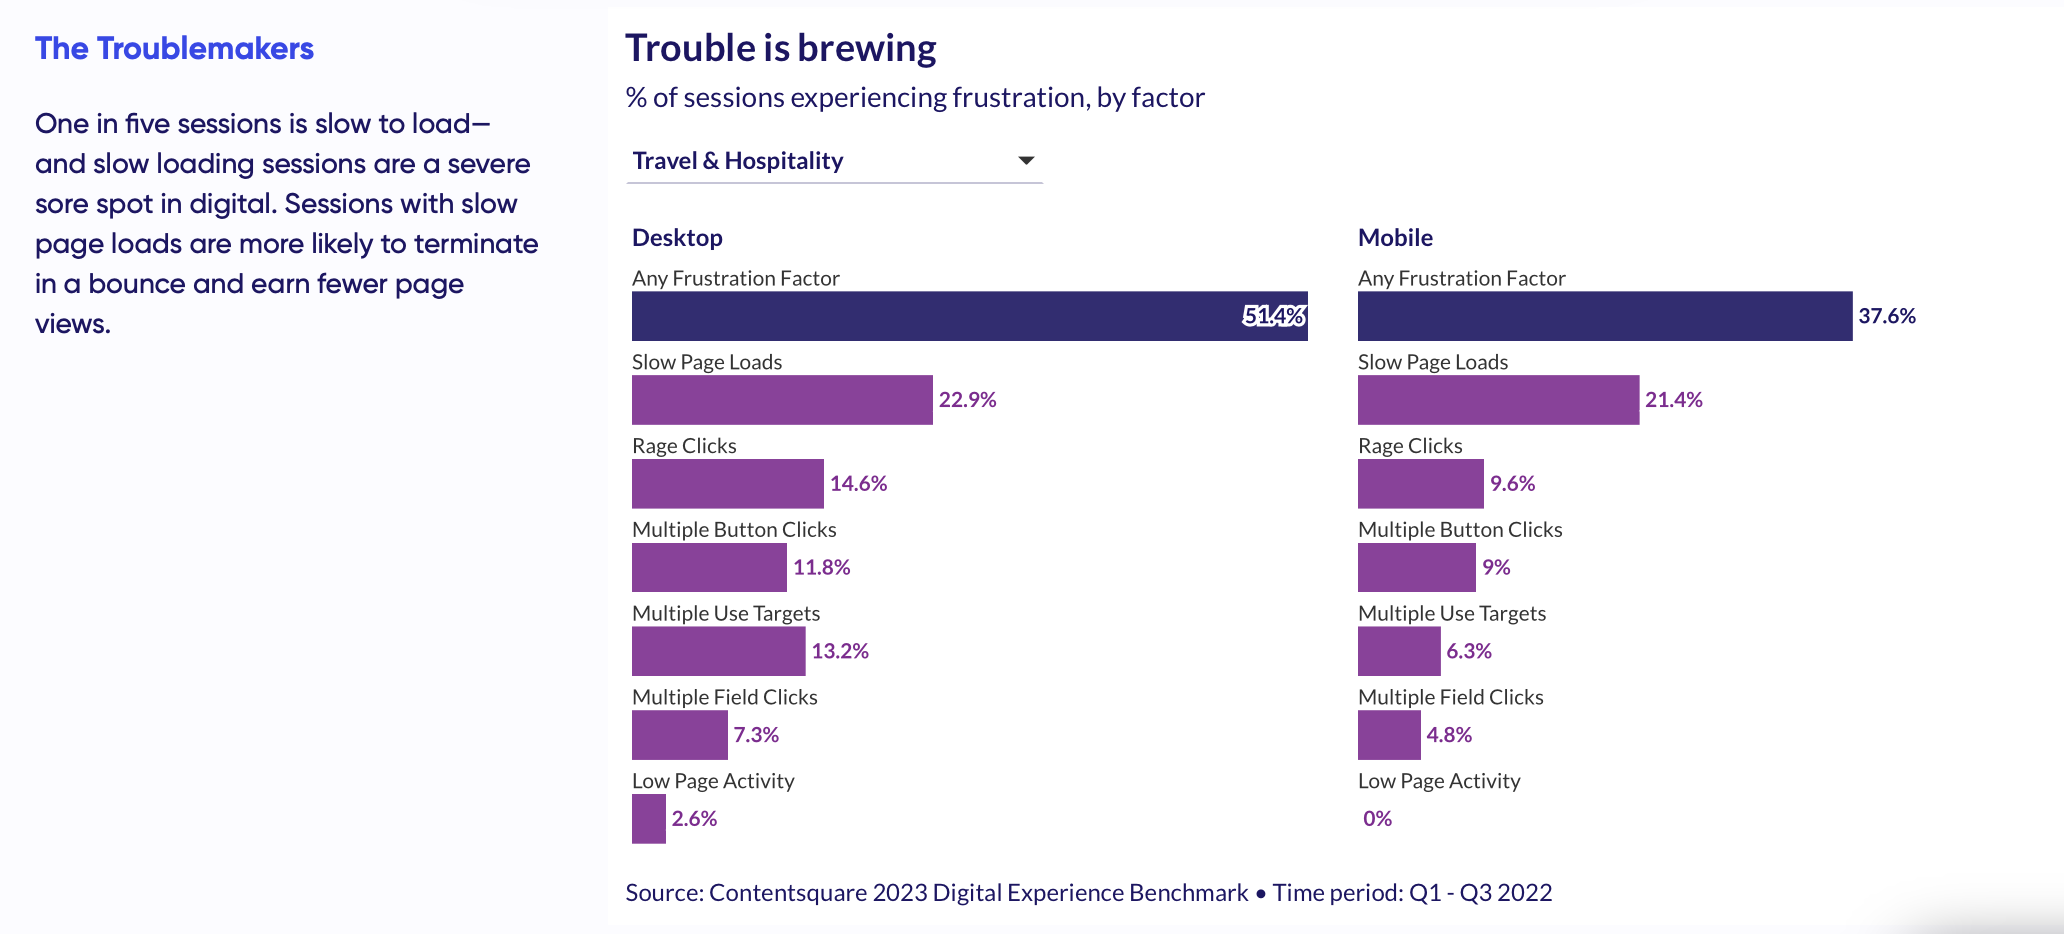
Find and fix friction before it bites your bottom line: Frustration is far too common across the customer journey. More than one in three visits (36%) cause frustration. Slow page load is the most frequent and impactful issue.
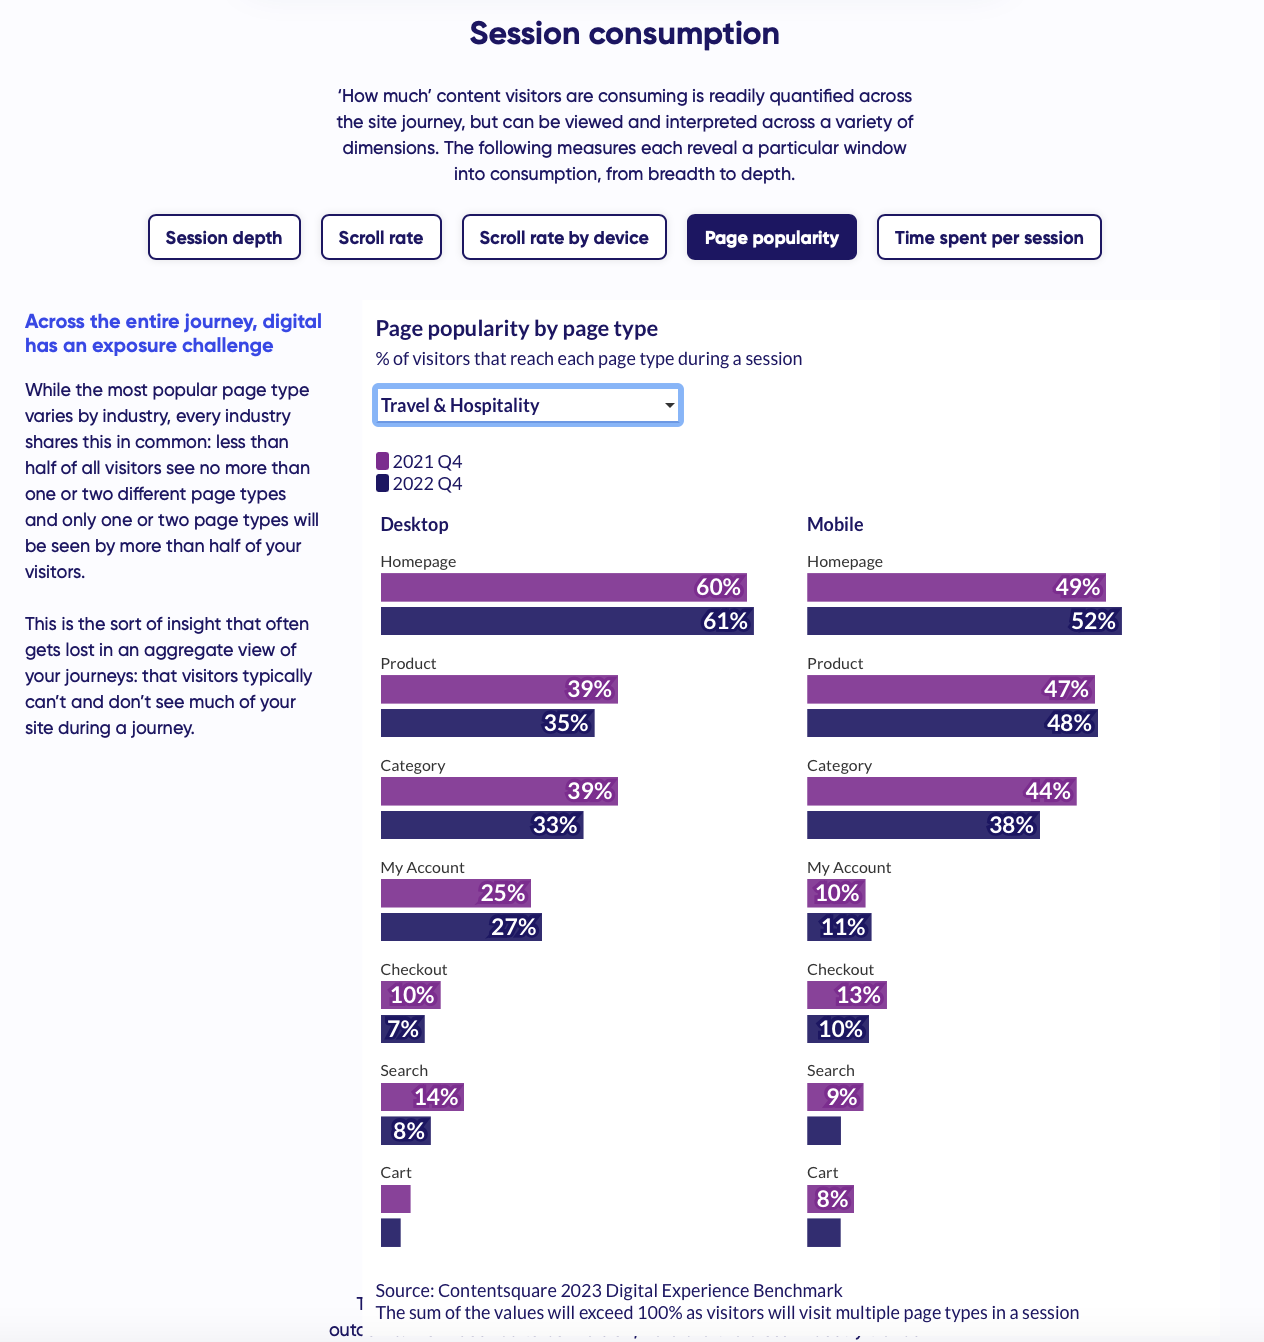
- Give love to MVPs: Most Visited Pages: Across industries, the pages that captured the most visits varied. Here’s the page type that most visitors viewed by industry:
-
- Home Page: Travel | Media
- My Account: Financial Services | Energy
- Product Page: Retail | Manufacturing
- Category Page: Telecommunications | Software | Services
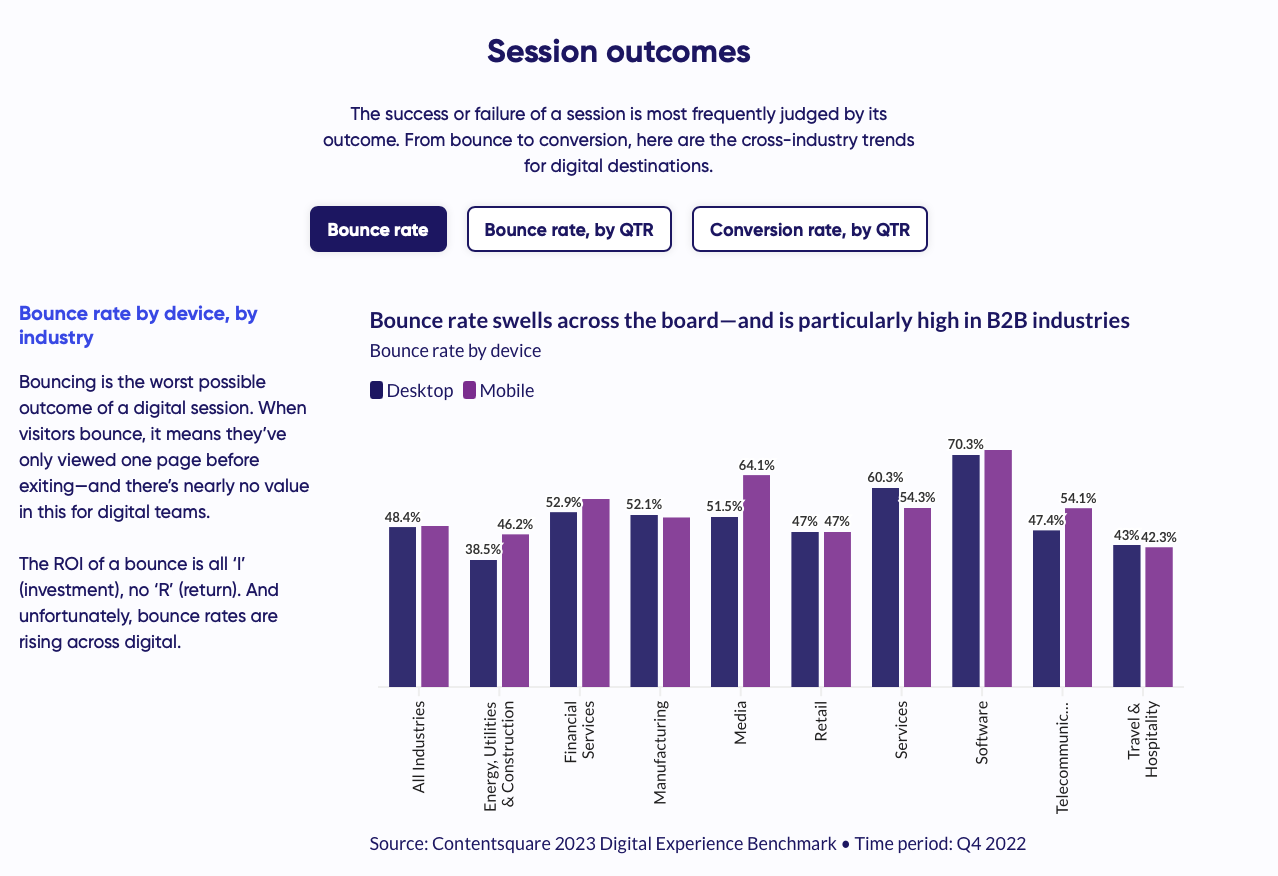
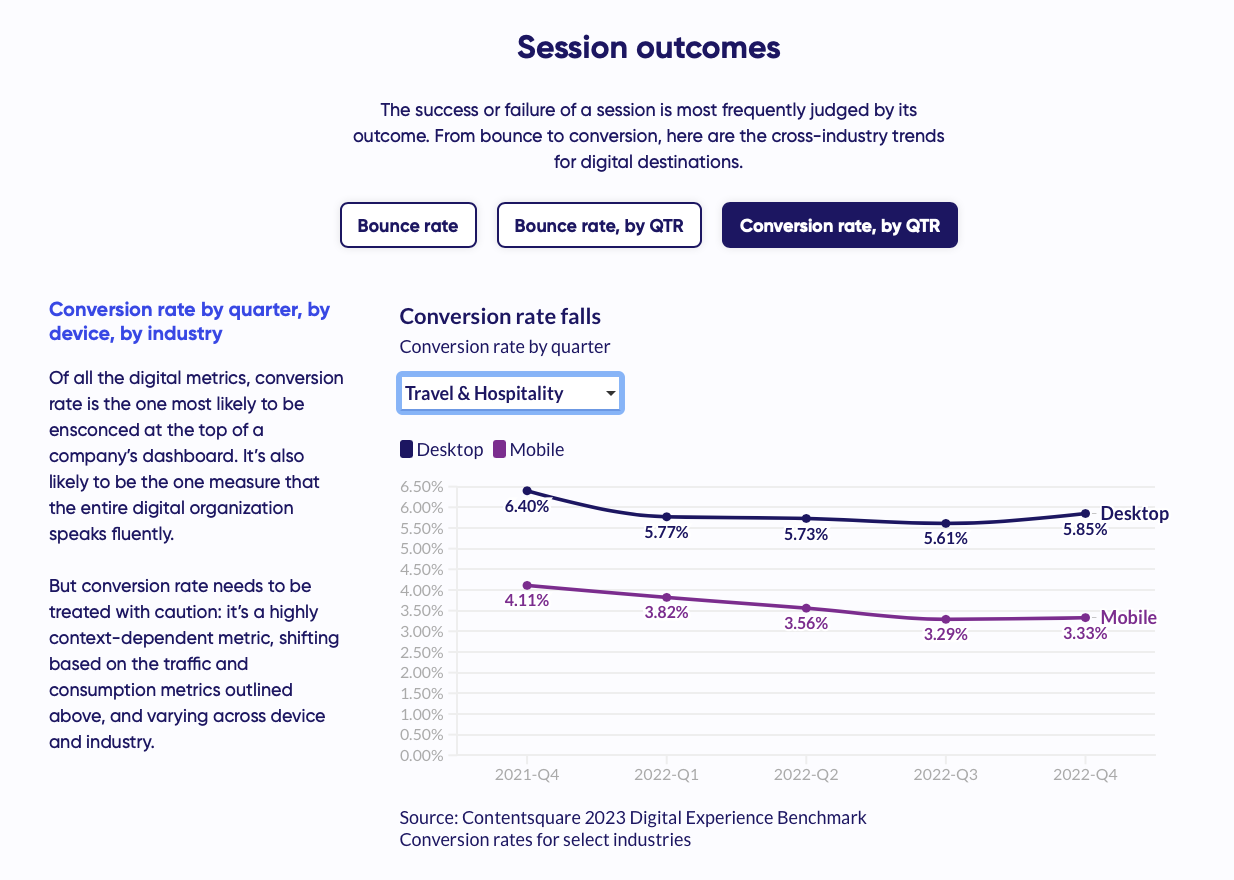
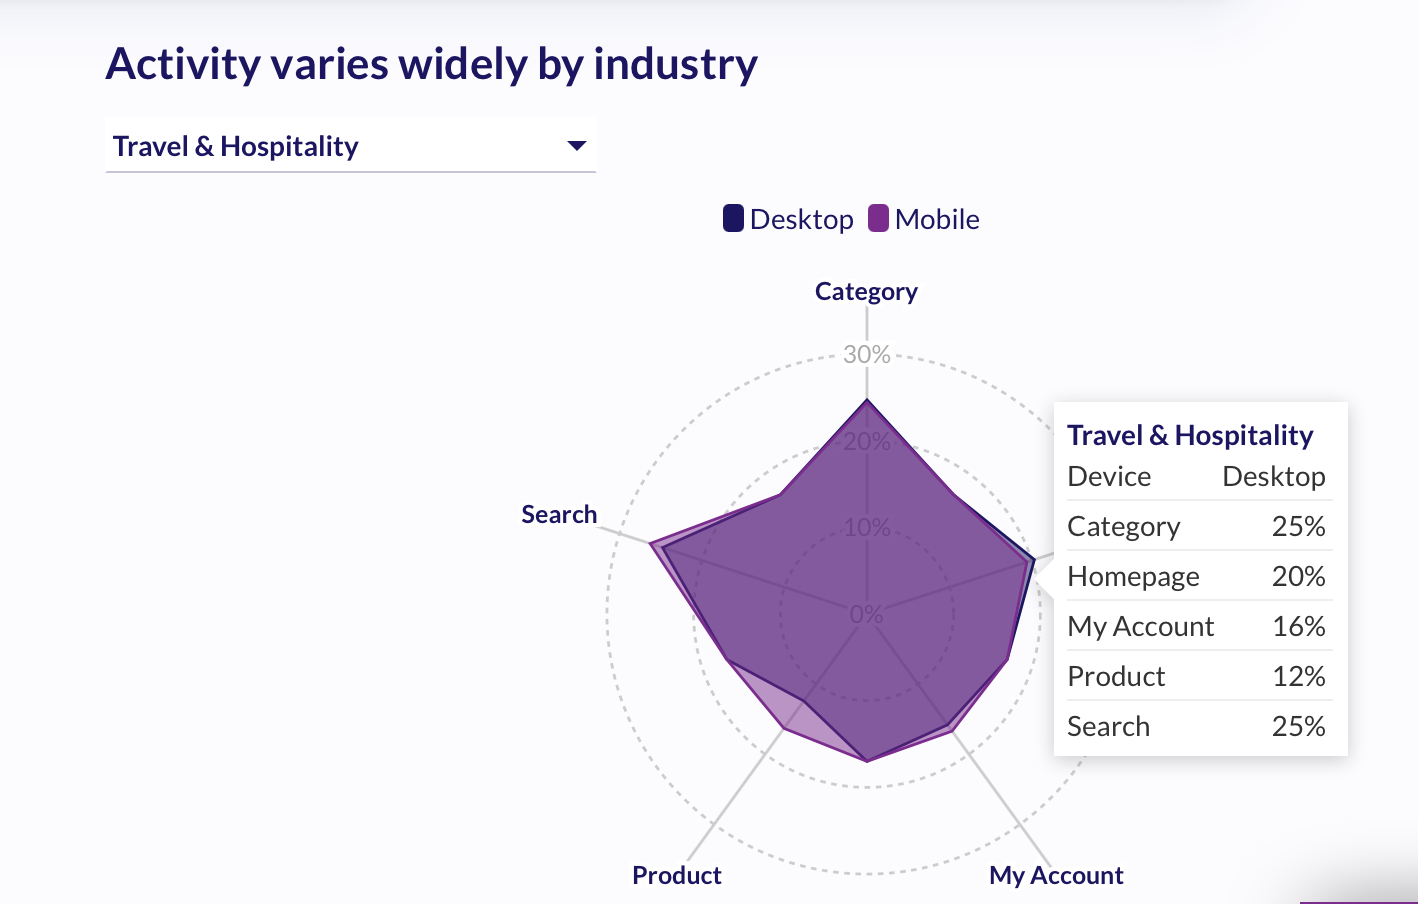
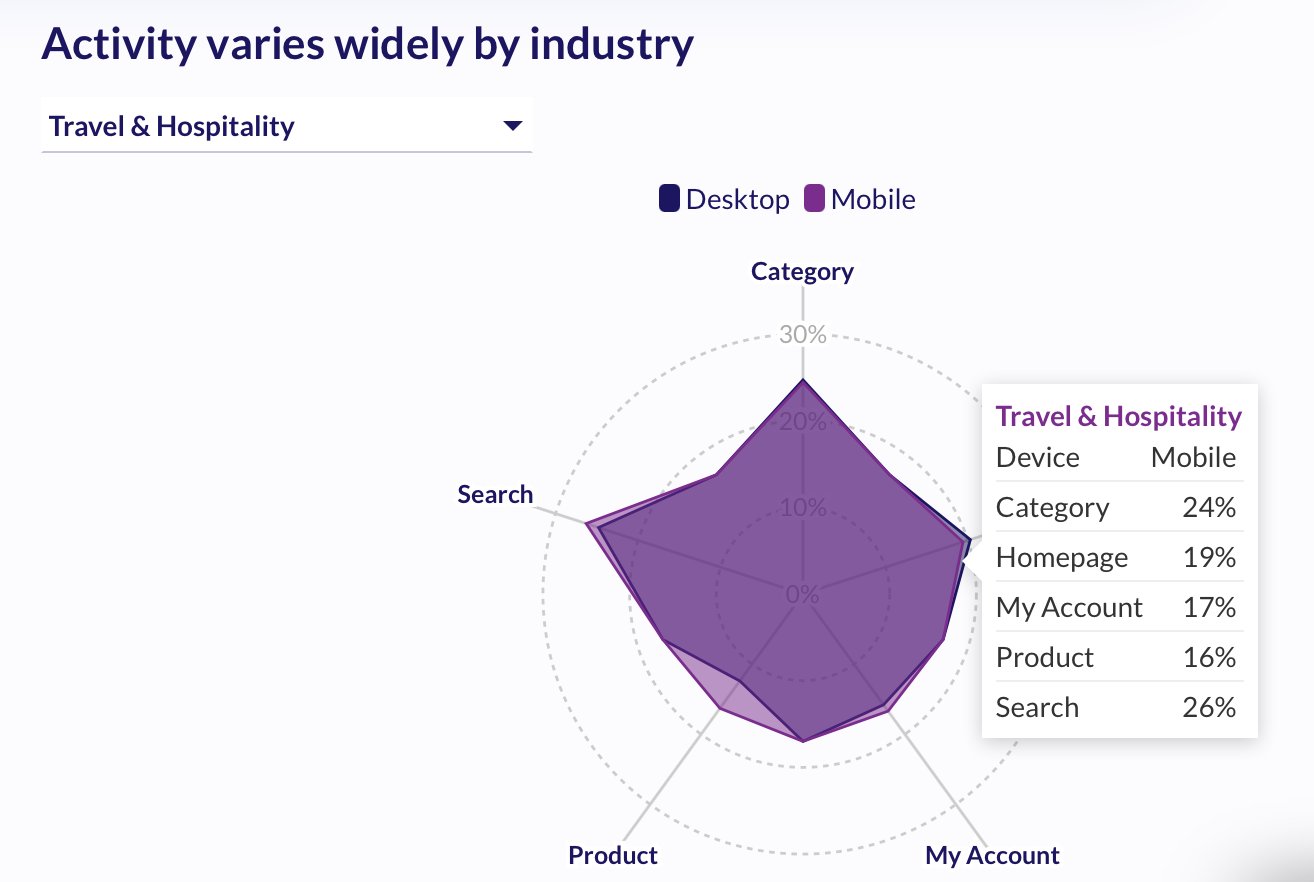
Travel & Hospitality:
- Traffic increased on “revenge travel” but conversion rate is significantly down indicating that DX needs improvement.
- In Travel & Hospitality “Search” and “Category” pages still dominate
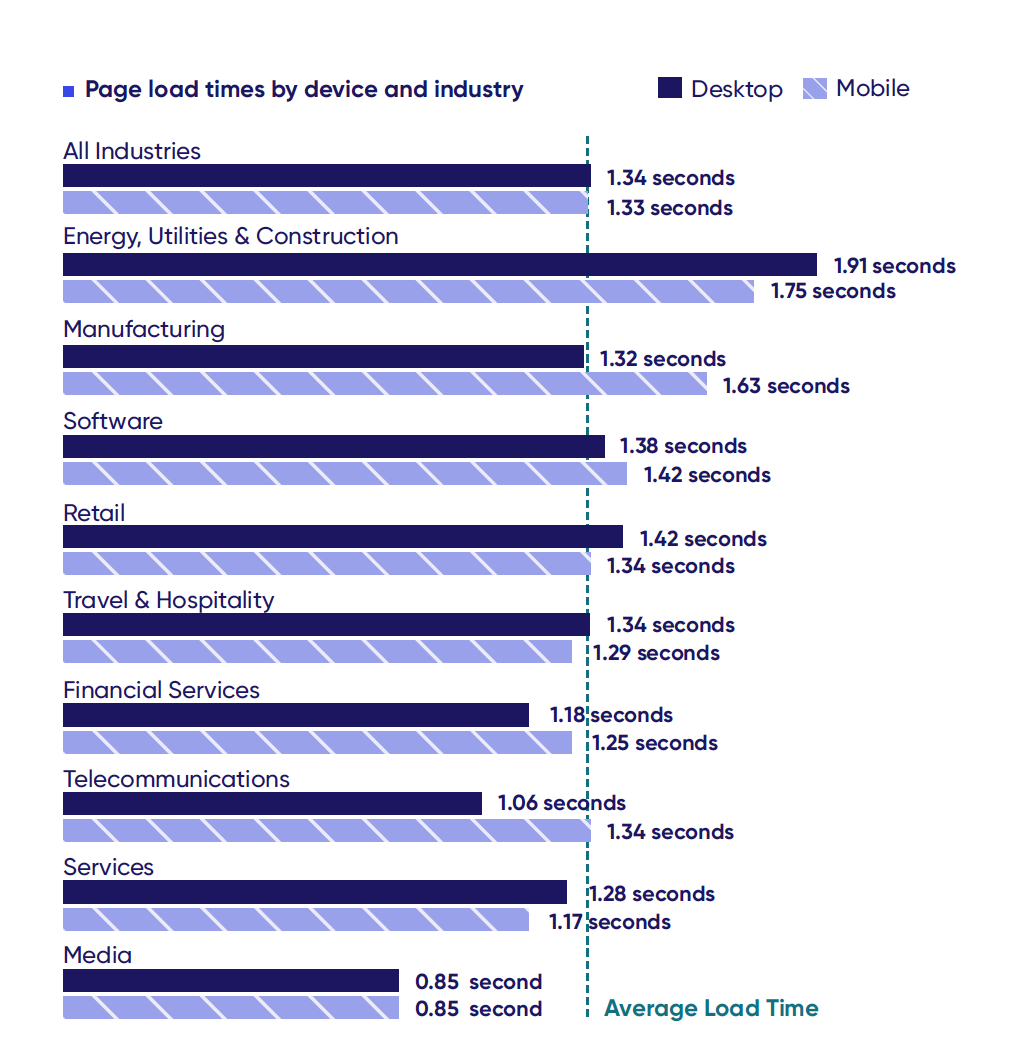
- Page loading speeds in Travel & Hospitality is on average 1.34 and 1.29 sec (desctop and mobile) which is significantly higher than “optimal” loading of leass than 1 sec resulting in lower conversion.
- Customers clearly indicate “slow page loads” as main frustration factor.
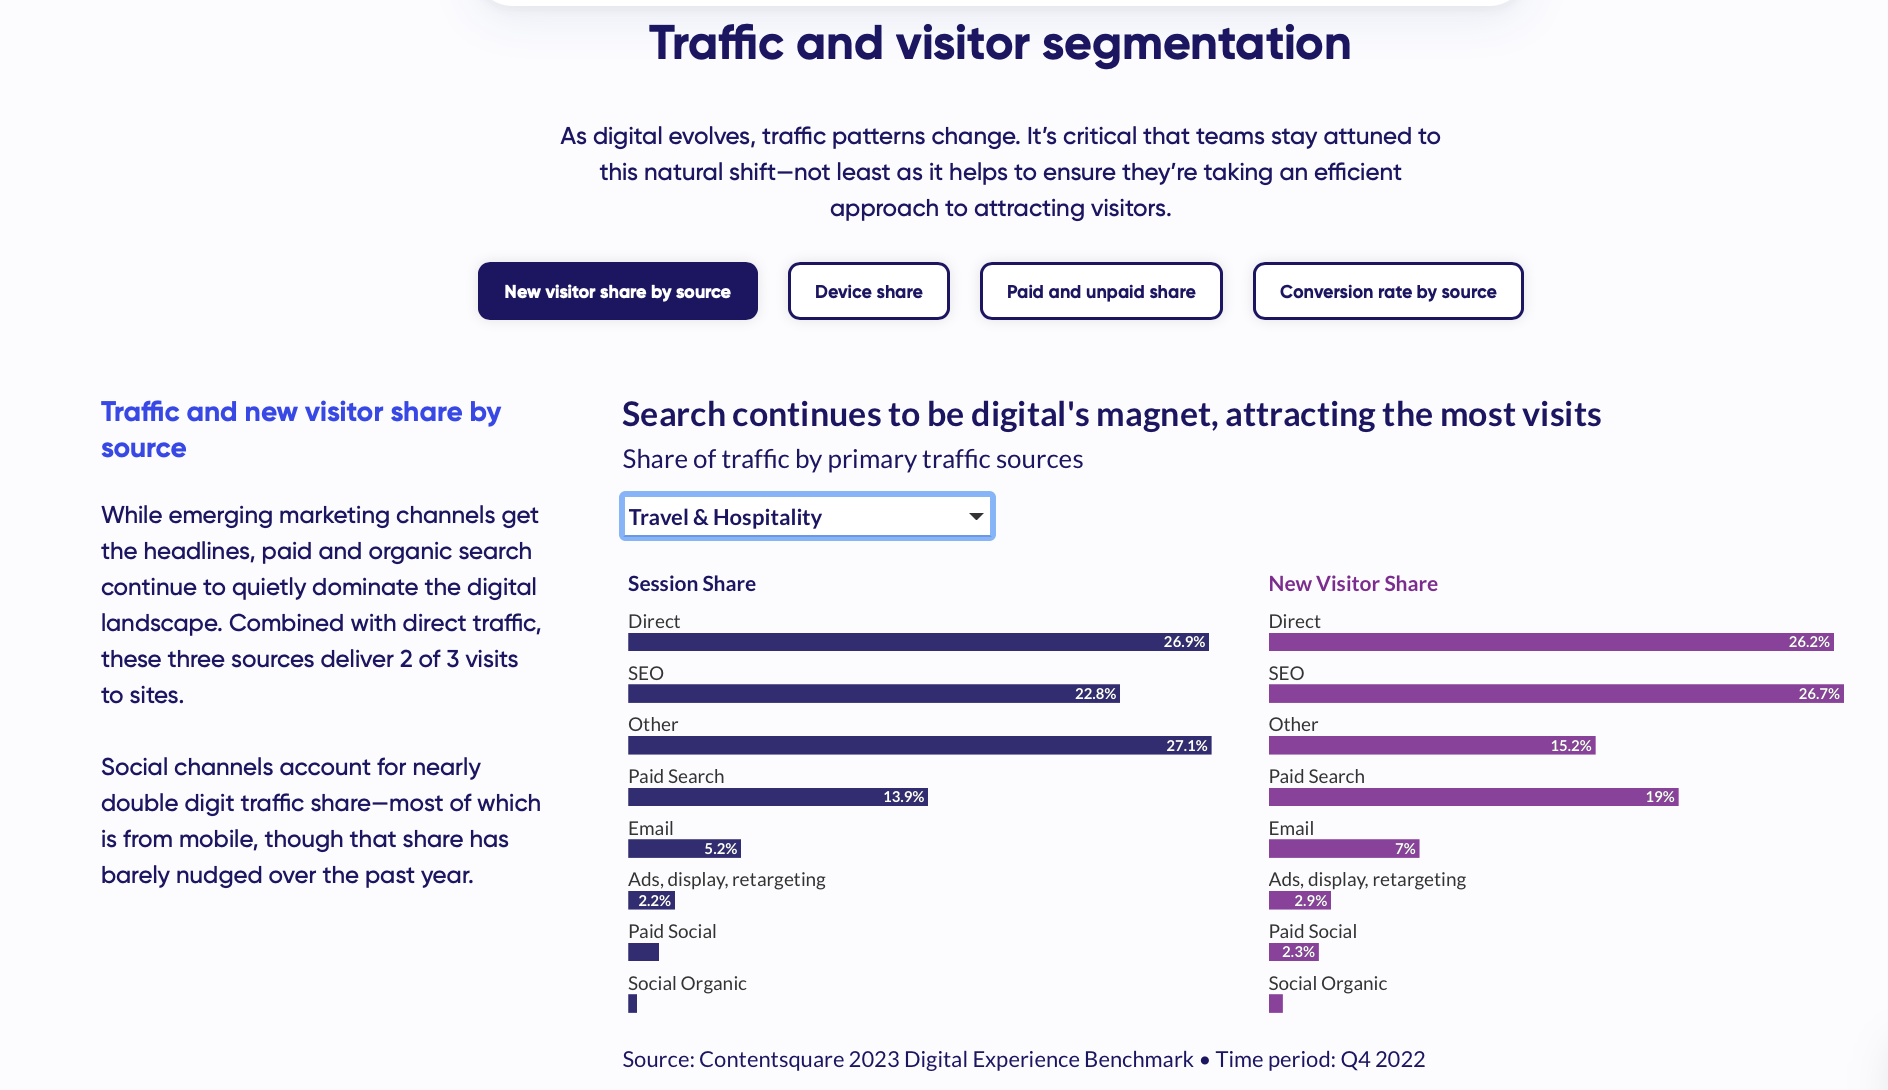
- Direct and organic search continue to quietly dominate the digital landscape. Combined with paid traffic, these three sources deliver 2 of 3 visits to sites.
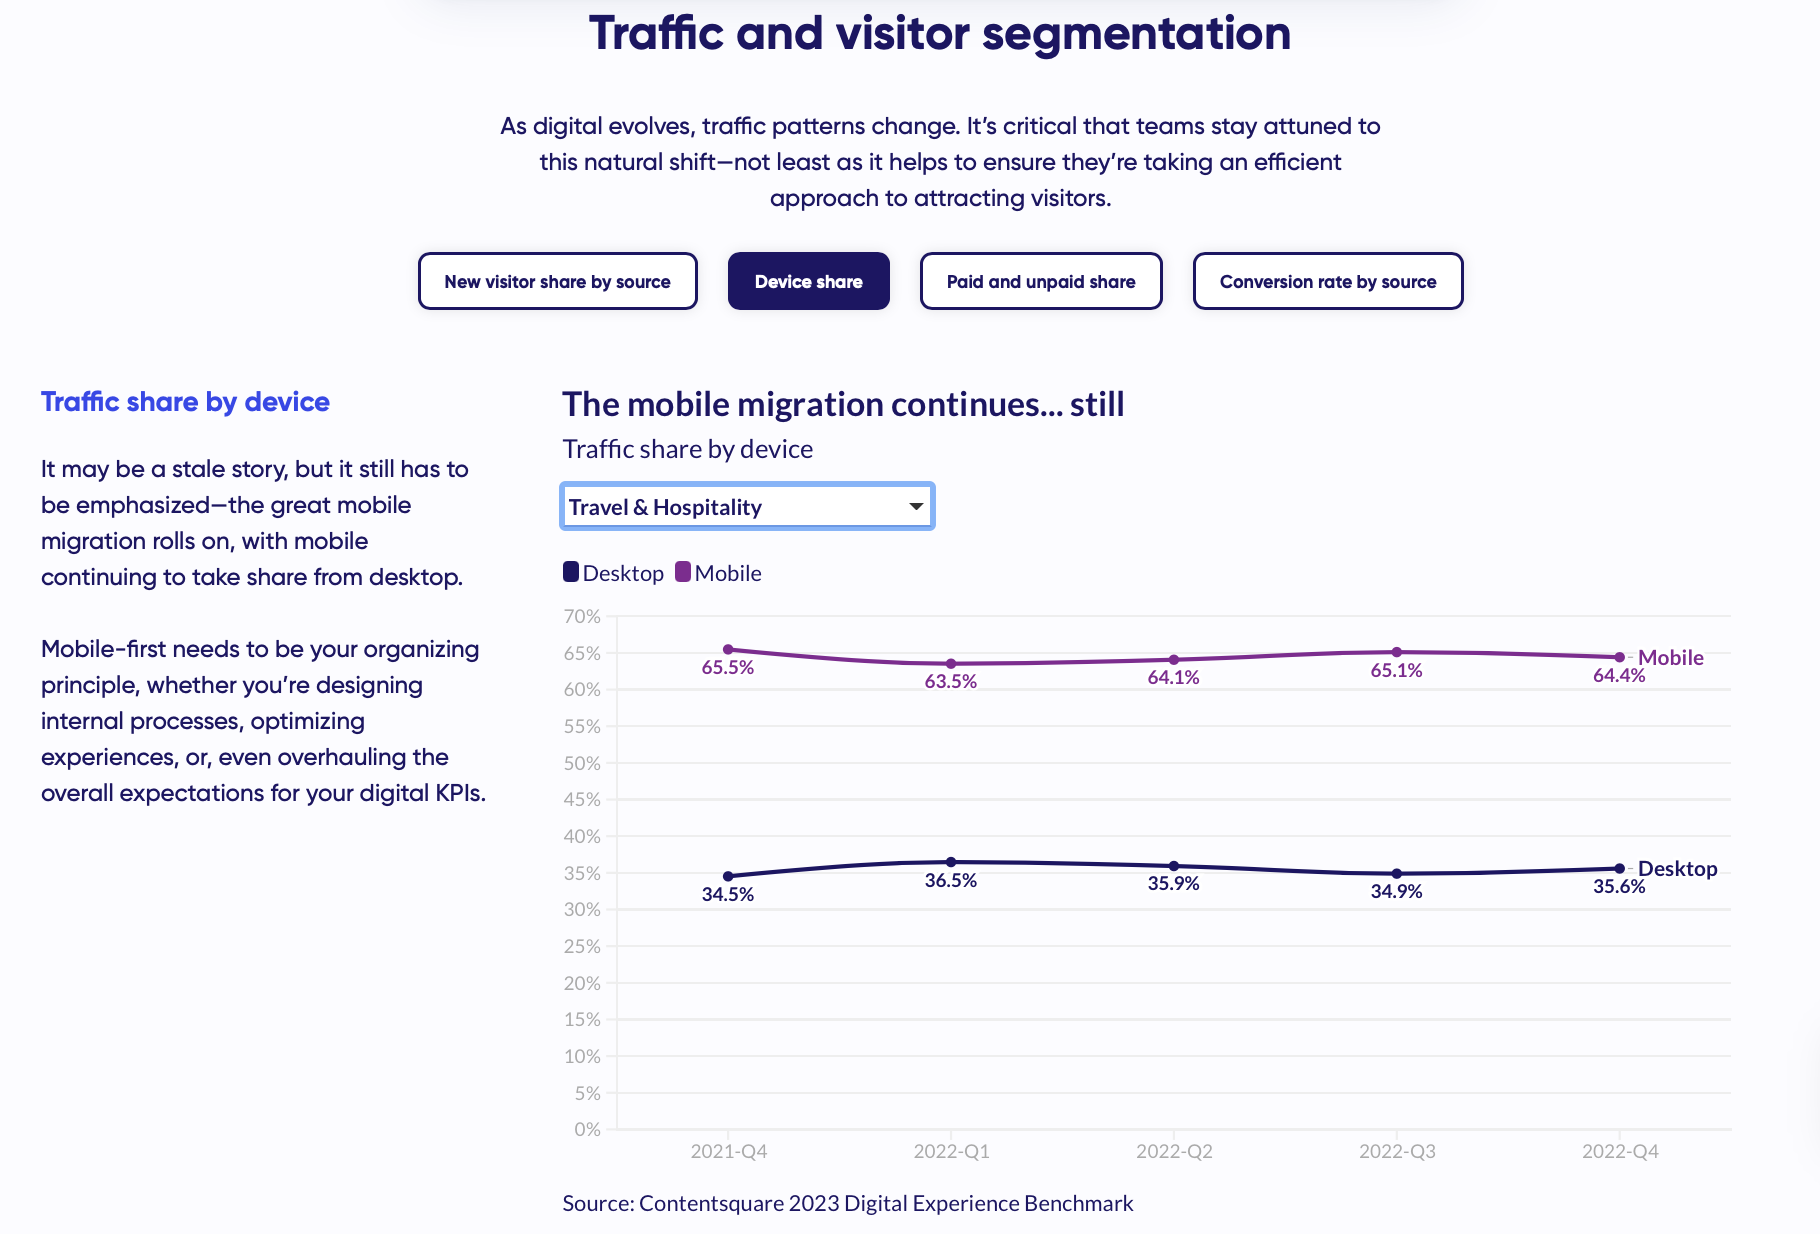
- Companies need to give priority to “mobile-first” approach and “feel” fo their mobile interface.
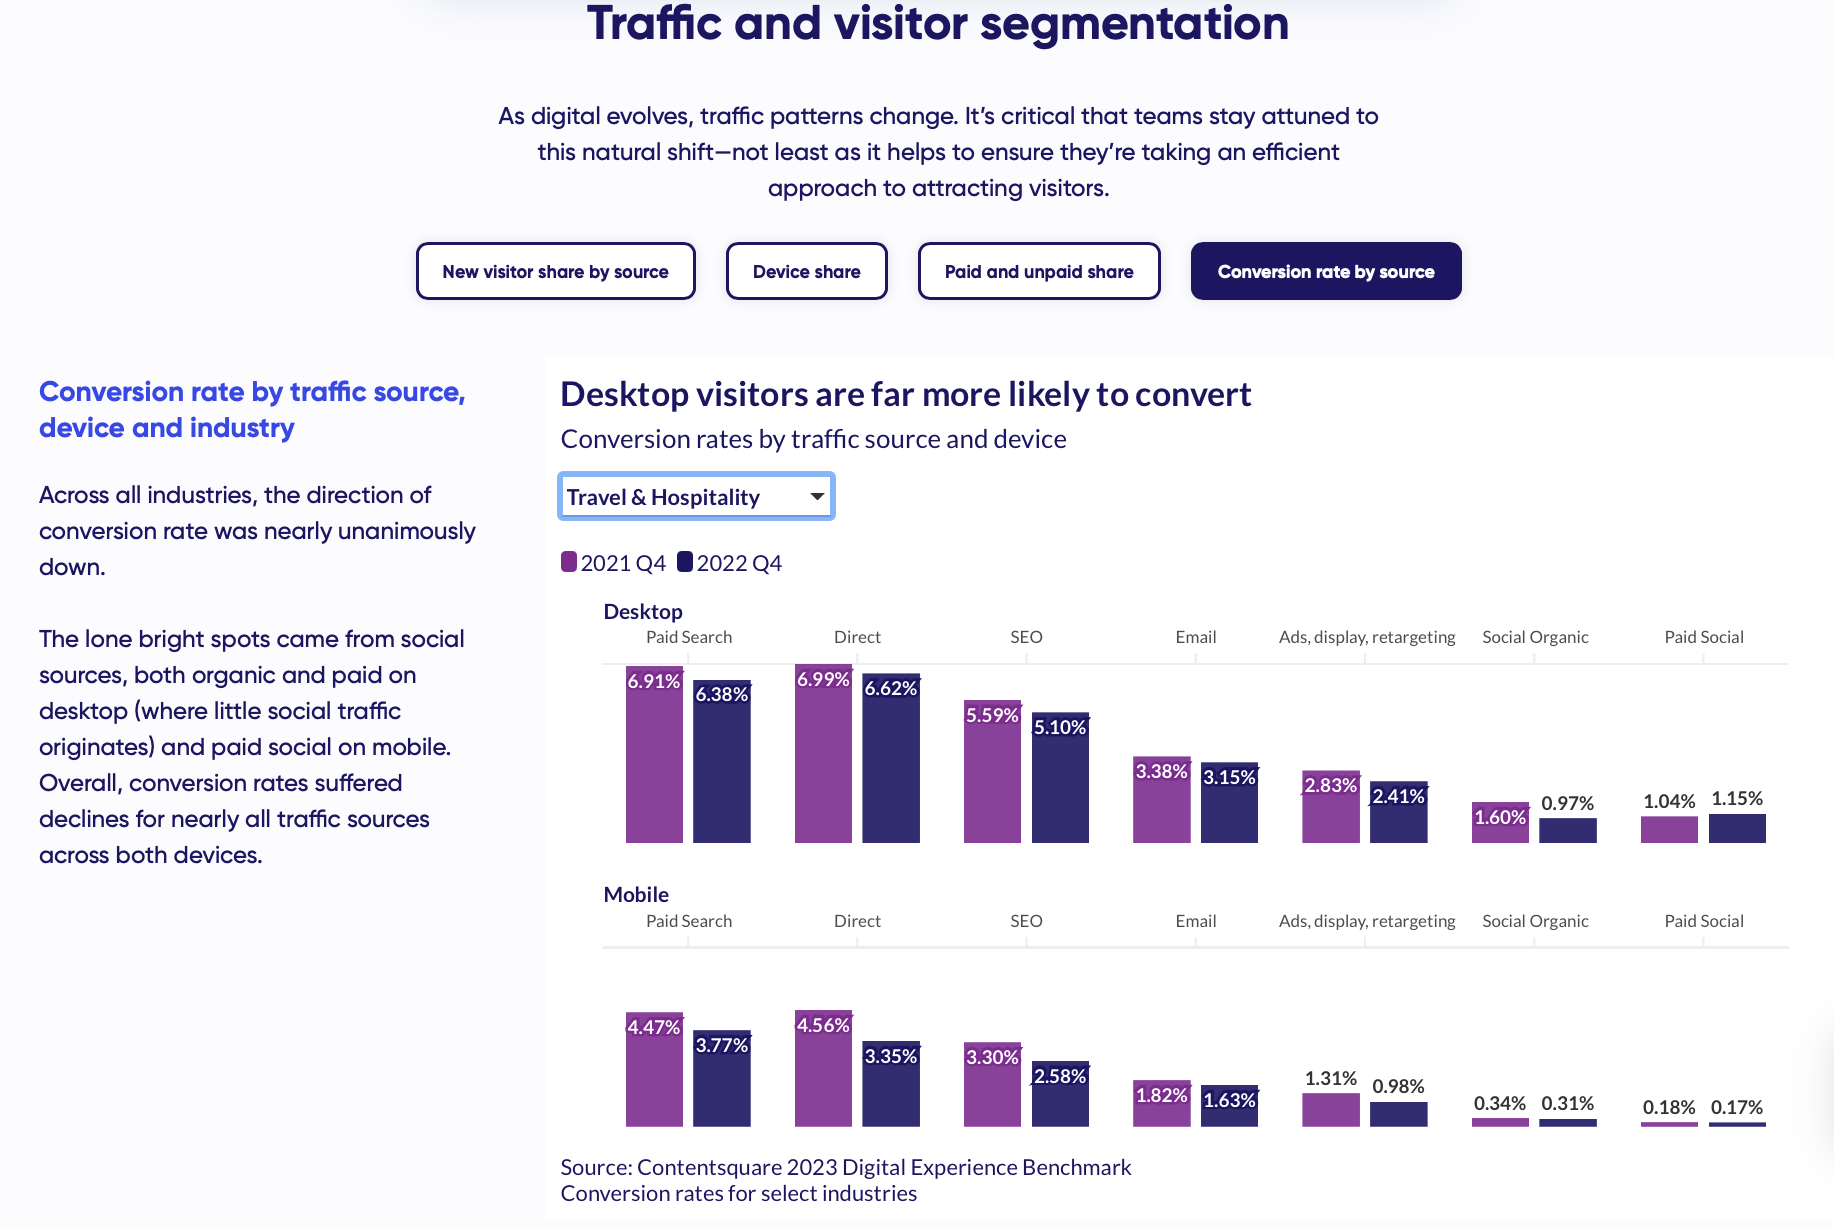
- Conversion rates fell accross al indurties and almost all channels with an exception of “Desktop-Paid Social”
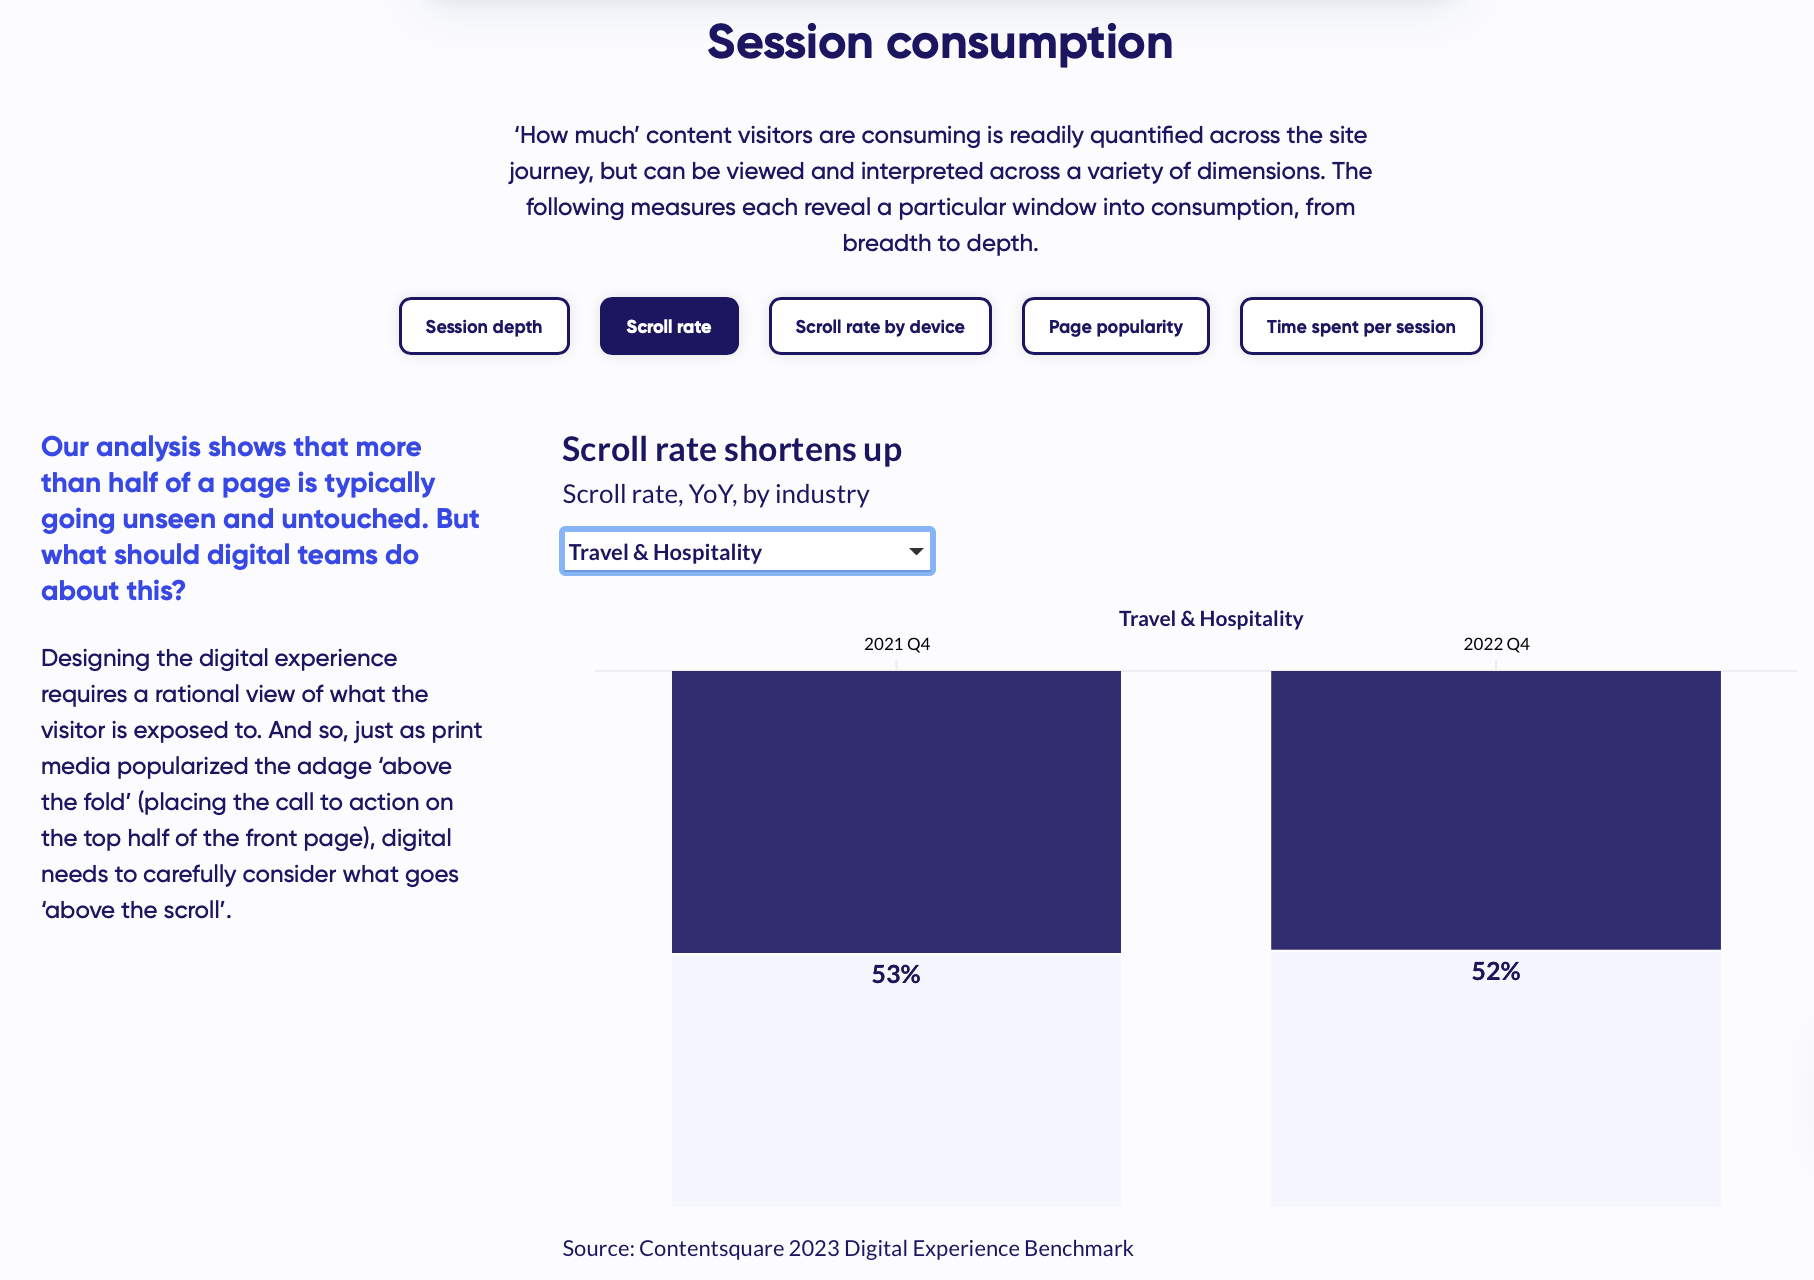
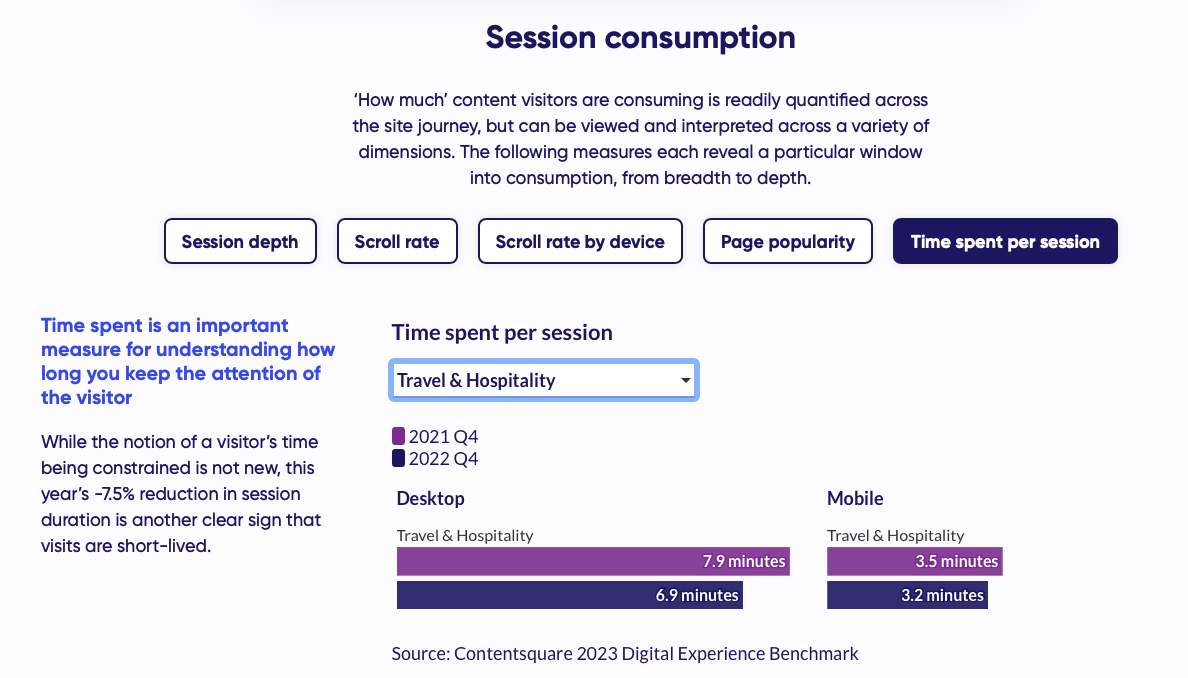
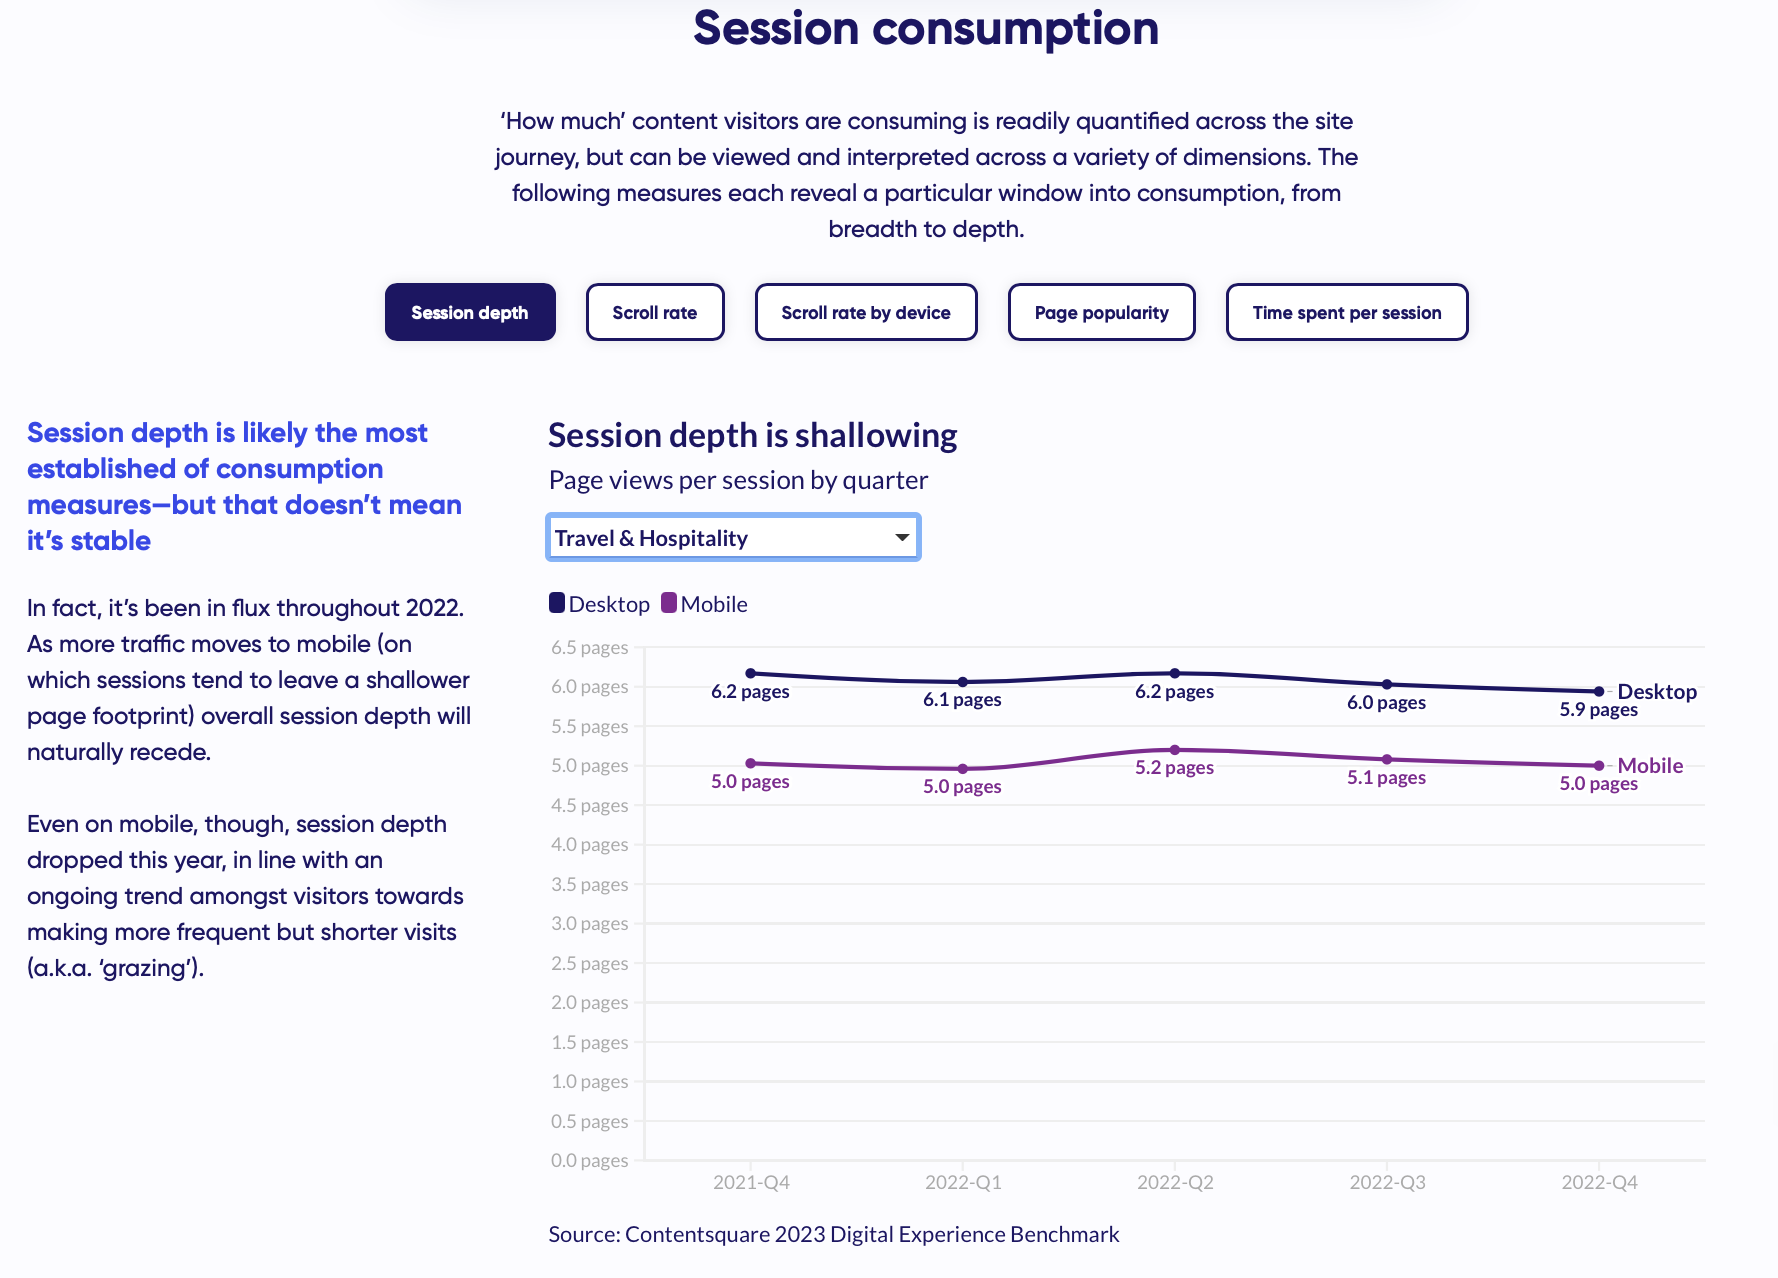
- Session consumption in staying relatively stable
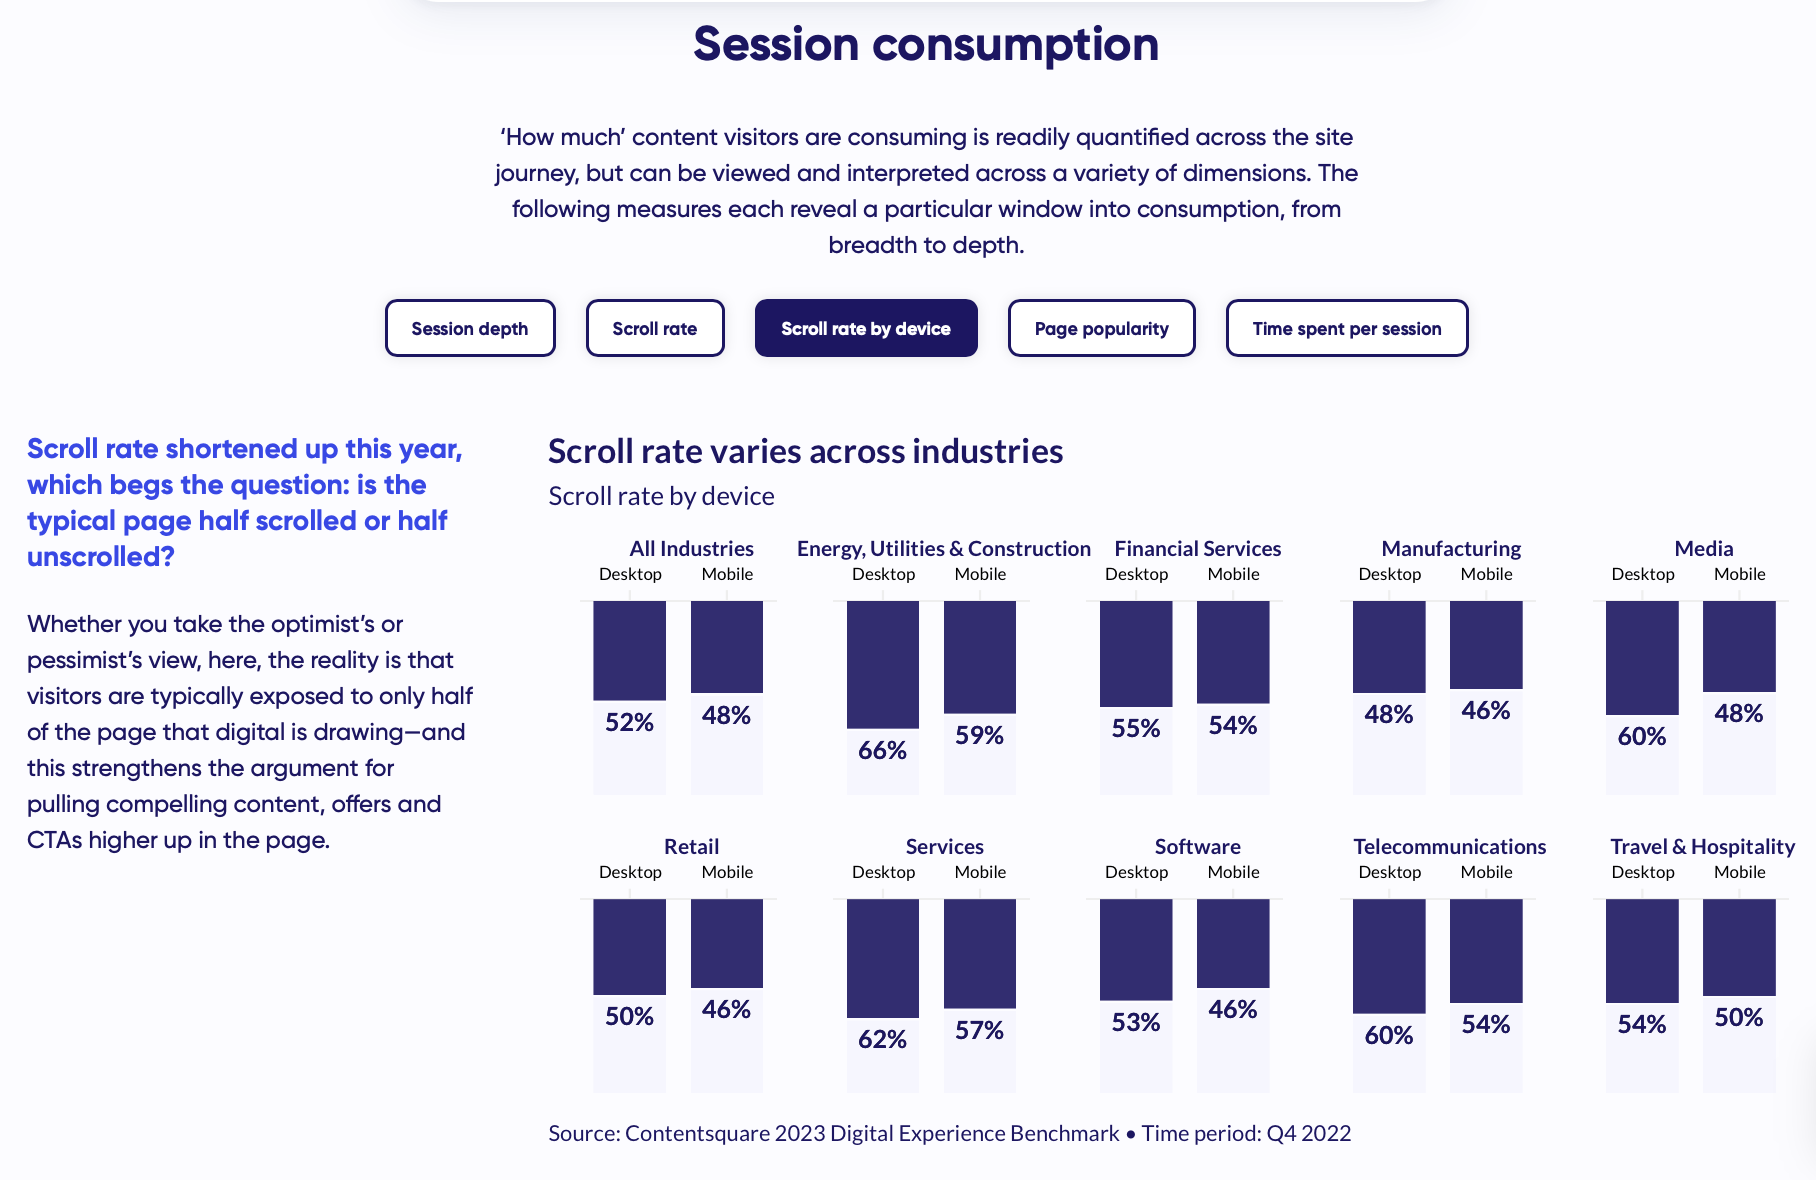
- Half page is on average unseen