


Despite challenges like fluctuating exchange rates, climate issues, and varying affordability, the desire to travel remains strong. People are becoming more strategic about their travel choices, leading to significant shifts in travel patterns in 2024.
 Mastercard
In 2024, the travel sector has been breaking boundaries. Through March 2024, consumer spending on travel remains strong, and passenger traffic has soared. Mastercard Economics Institute anticipates this momentum will continue as consumers prioritize meaningful experiences and allocate more of their budgets to travel. More than ever, consumers are empowered by a strong labor market to embrace experiences with travel at the top of the list.
We found that travelers are extending their trips by an extra day over the 12 months ending March 2024 compared to the same period in 2019, highlighting a growing desire for more immersive and meaningful travel experiences. In addition to air travel, vacationing by cruise has experienced extraordinary growth, surpassing 2019 records.
Despite challenges like fluctuating exchange rates, climate concerns and varying levels of affordability, the desire to travel remains strong. People are becoming more strategic about how, when, and where they travel, with 2024 seeing significant shifts in travel patterns.
In the Mastercard Economics Institute’s fifth annual travel report, “Travel Trends 2024: Breaking Boundaries,” we explore these evolving trends and the state of travel in 2024 and beyond.
Top Themes in Travel
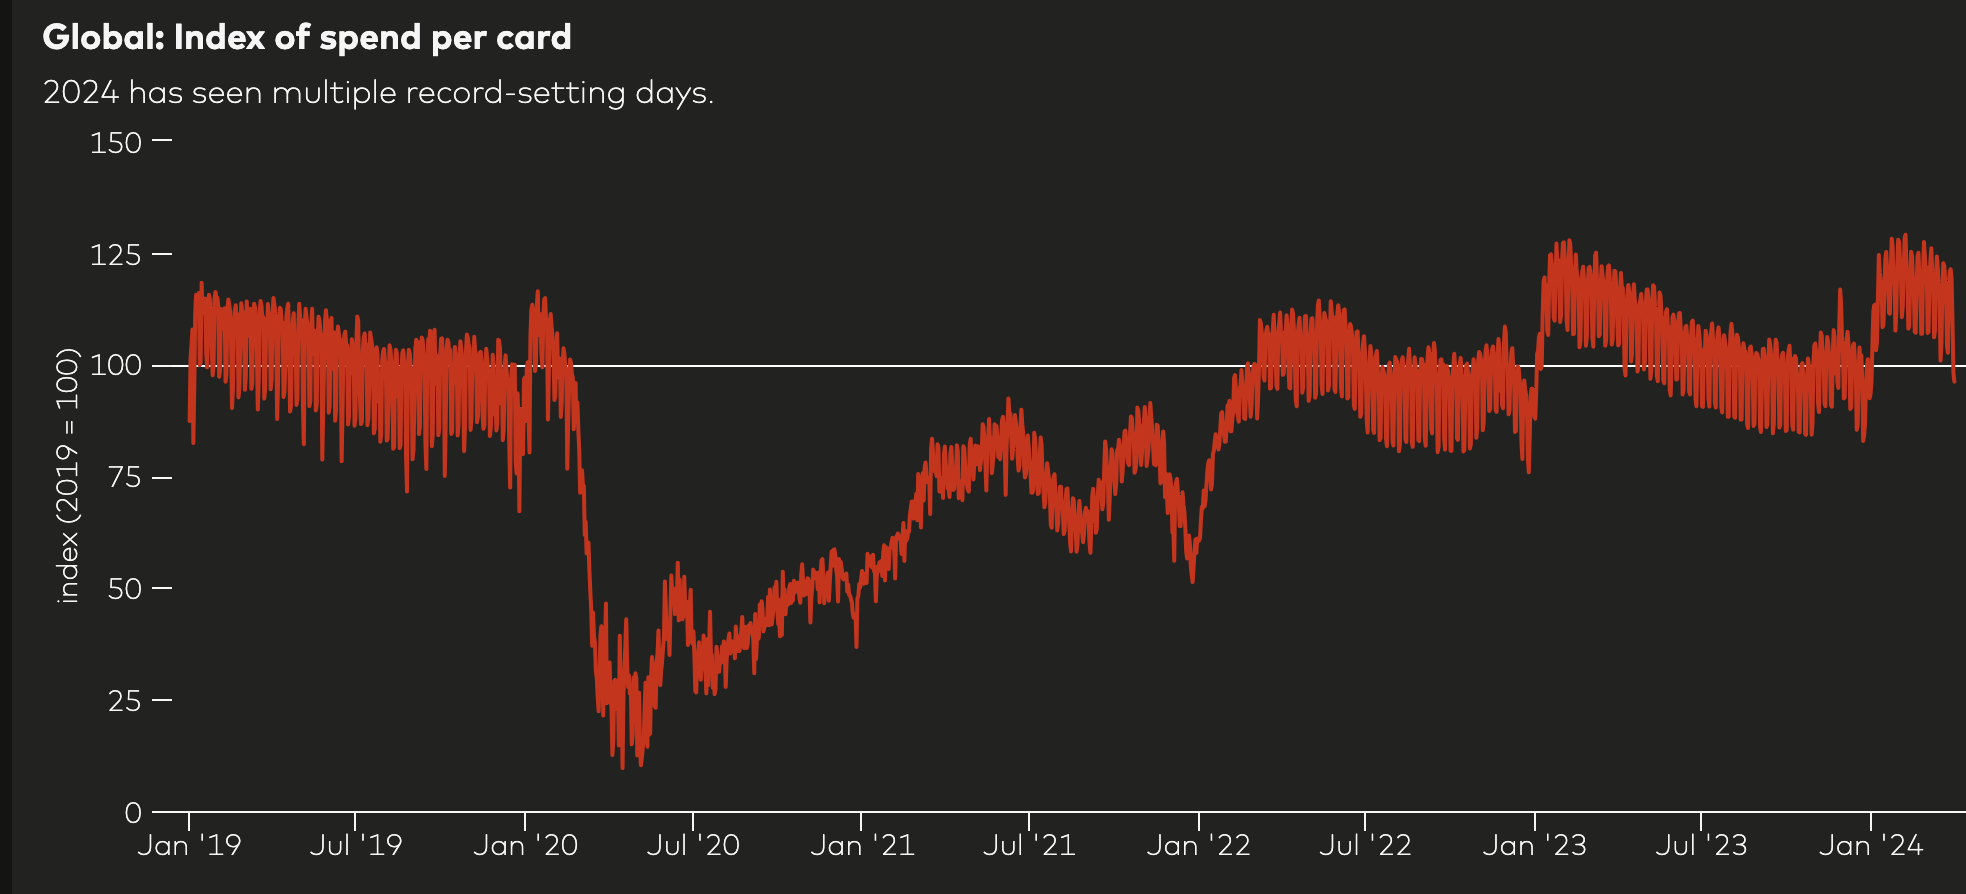
Globally, nine out of the last 10 all-time record spending days in both cruise and airlines have happened in 2024. 1
2024 has kicked off with strong growth in the travel industry – in terms of spending but also the number of people traveling. The year started with strong momentum, and the Mastercard Economics Institute expects it to continue:
Some noteworthy examples of this strength in 2024:
- Passengers traveling: An all-time high of about 15.9 million Americans traveled internationally in Q1 2024 while Japan welcomed over 3 million passenger arrivals in March 2024 2
- Consumer spending: As of March 2024, nine out of the last 10 record-setting spending days in the global cruise and airline industry were in 2024 3
- Leisure for longer: Tourists spend more time on vacation, by about one extra day relative to pre-COVID trends, particularly for lower-cost destinations
- Traveling for events: Memorable events are driving travel trends, whether it is for concerts or sporting events – look out for a rush of travelers to Munich for the opening game of the European Championship
- Top gainers: Japan, Ireland and Romania experienced the strongest growth in share of spending from tourists relative to last year
Analyzing aggregated & anonymized Mastercard transaction data, we find that records are being broken in the travel economy, as illustrated by the chart below. We can thank the solid economic backdrop – the healthy labor market around the world is allowing consumers to spend more on travel.
Leisure for Longer
Worldwide, travelers are extending their trips by about a day on average.
We found that tourists are spending more time on vacation – about one extra day relative to what was normal pre-COVID. Longer stays in destinations generally translate to longer spend per trip, too, which benefits local businesses.
The Middle East and Africa (MEA) region and Europe have been benefitting the most from this trend, both with roughly two extra days spent while in destination. Conversely, the United States has benefitted less from this new trend, having seen a smaller increase in extended trip lengths. 4
In the last section of this report, we dive deeper into why this has been happening.

Eventful Economy
This year, Munich, Germany, ranks as the top trending destination due to the European Championship.
Consumers are traveling for memorable events ranging from Solar Eclipses to Taylor Swift shows, Carnival in Brazil, and the Cricket World Cup. These events provide strong incremental spending lift to businesses near and adjacent to the area. For example: 5
- The spending lift from tourists during the 2024 Carnival in Rio de Janeiro at restaurants, bars and grocery stores increased 156% above what would have happened without the event.
- During the US solar eclipse, hotel sales within the path of totality experienced a 71% sales boost over normal business.
- Restaurant sales within 2.5 miles of the Taylor Swift concerts in 2023 gained an incremental 68% above regular business.
The rest of 2024 is earmarked with a range of notable events that the Mastercard Economics Institute expects to attract record numbers of travelers from around the world. In the “trending destinations” section, we highlight the destinations showing the greatest shift in demand from June 2024 through August 2024. Among the top of the list? Munich, Germany, where the opening game of the European Championship will occur.
Pricey Push & Pull
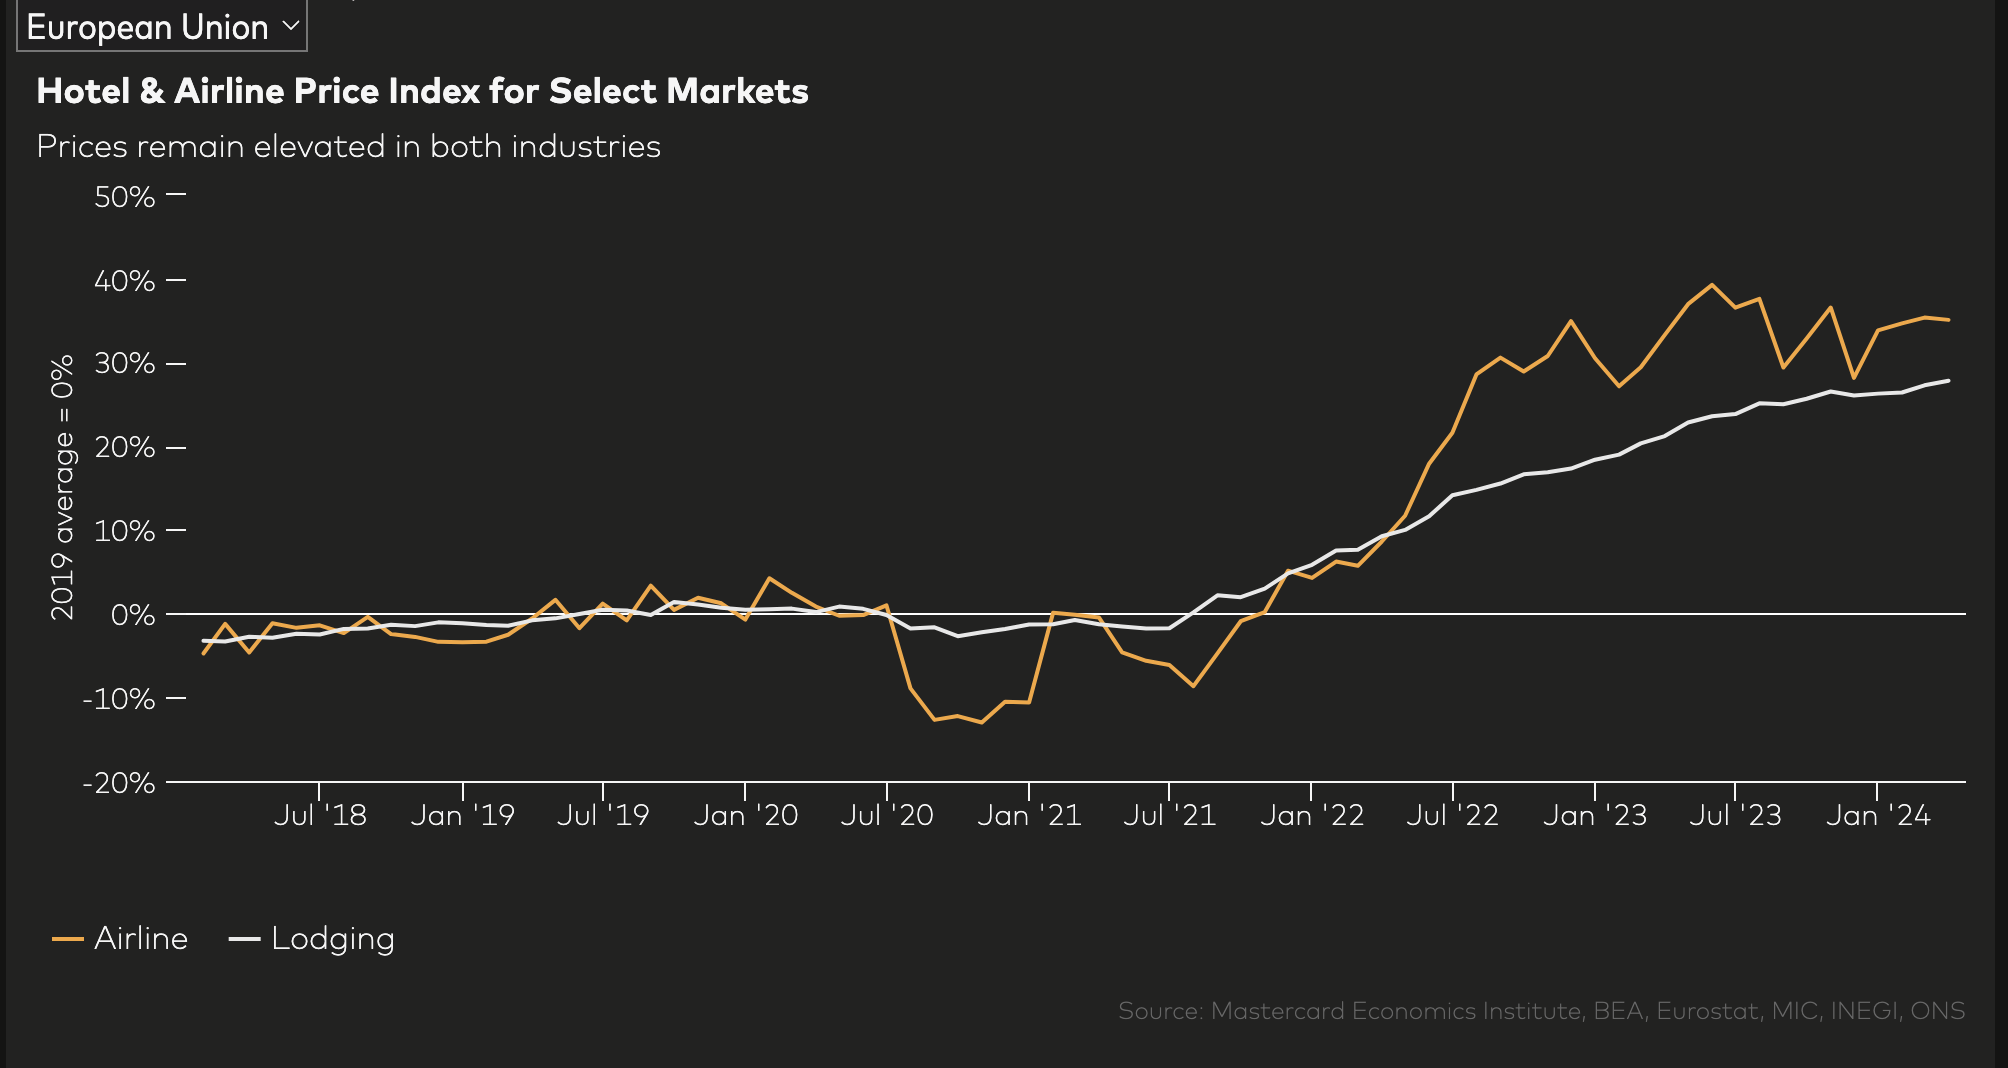
Prices remain elevated, but the travel industry is well positioned with a resilient consumer.
In the travel & leisure industry, consumer prices – especially in the hotel industry – remain elevated relative to pre-pandemic levels. 6 With elevated price levels, we’ve found a growing number of consumers seek out wallet-friendly travel options. Why are prices in the travel industry still elevated?
In economics, the terms “cost-push” and “demand-pull” are sometimes used to describe why inflation is happening. For this year, both concepts are happening.
Cost-push inflation is the type of inflation that is caused when the cost to provide a service like flying or lodging goes up. In the travel & leisure hospitality, there are many such pressures. A mix of constrained capacity, supply shortages and elevated labor costs are contributing to “cost-push” inflation in 2024. Examples relevant to 2024 include plane shortages, pilot shortages, and broad increases in real wage growth.
The other type of driver of inflation – demand-pull – happens when there are more people who want to travel than there are available seats or rooms, prompting higher prices. The Mastercard Economics Institute expects to continue seeing many such occurrences of demand-pull inflation throughout the course of the year, in part due to the experience economy and extremely high extent of travel intentions. For example, when more people want to attend their favorite sporting event than there are available rooms, accommodations services providers can increase prices and remain fully occupied. While it is relatively more painful to shell out extra money for consumers, the rooms will still be fully booked, and this serves as a relief to hotels & motels, which were among the most severely impacted due to protracted shutdowns in 2020-2022. The pent-up demand has been providing a breath of fresh air to the hospitality industry in 2024.
The result? Prices remain elevated in the travel, leisure & hospitality industry – but not worryingly so – globally, the Mastercard Economics Institute expect continued real disposable income growth to serve as a tailwind in 2024. Paired with a strong willingness to travel and greater ease of doing so, the Mastercard Economics Institute expects continued momentum in the space in 2024 and beyond.
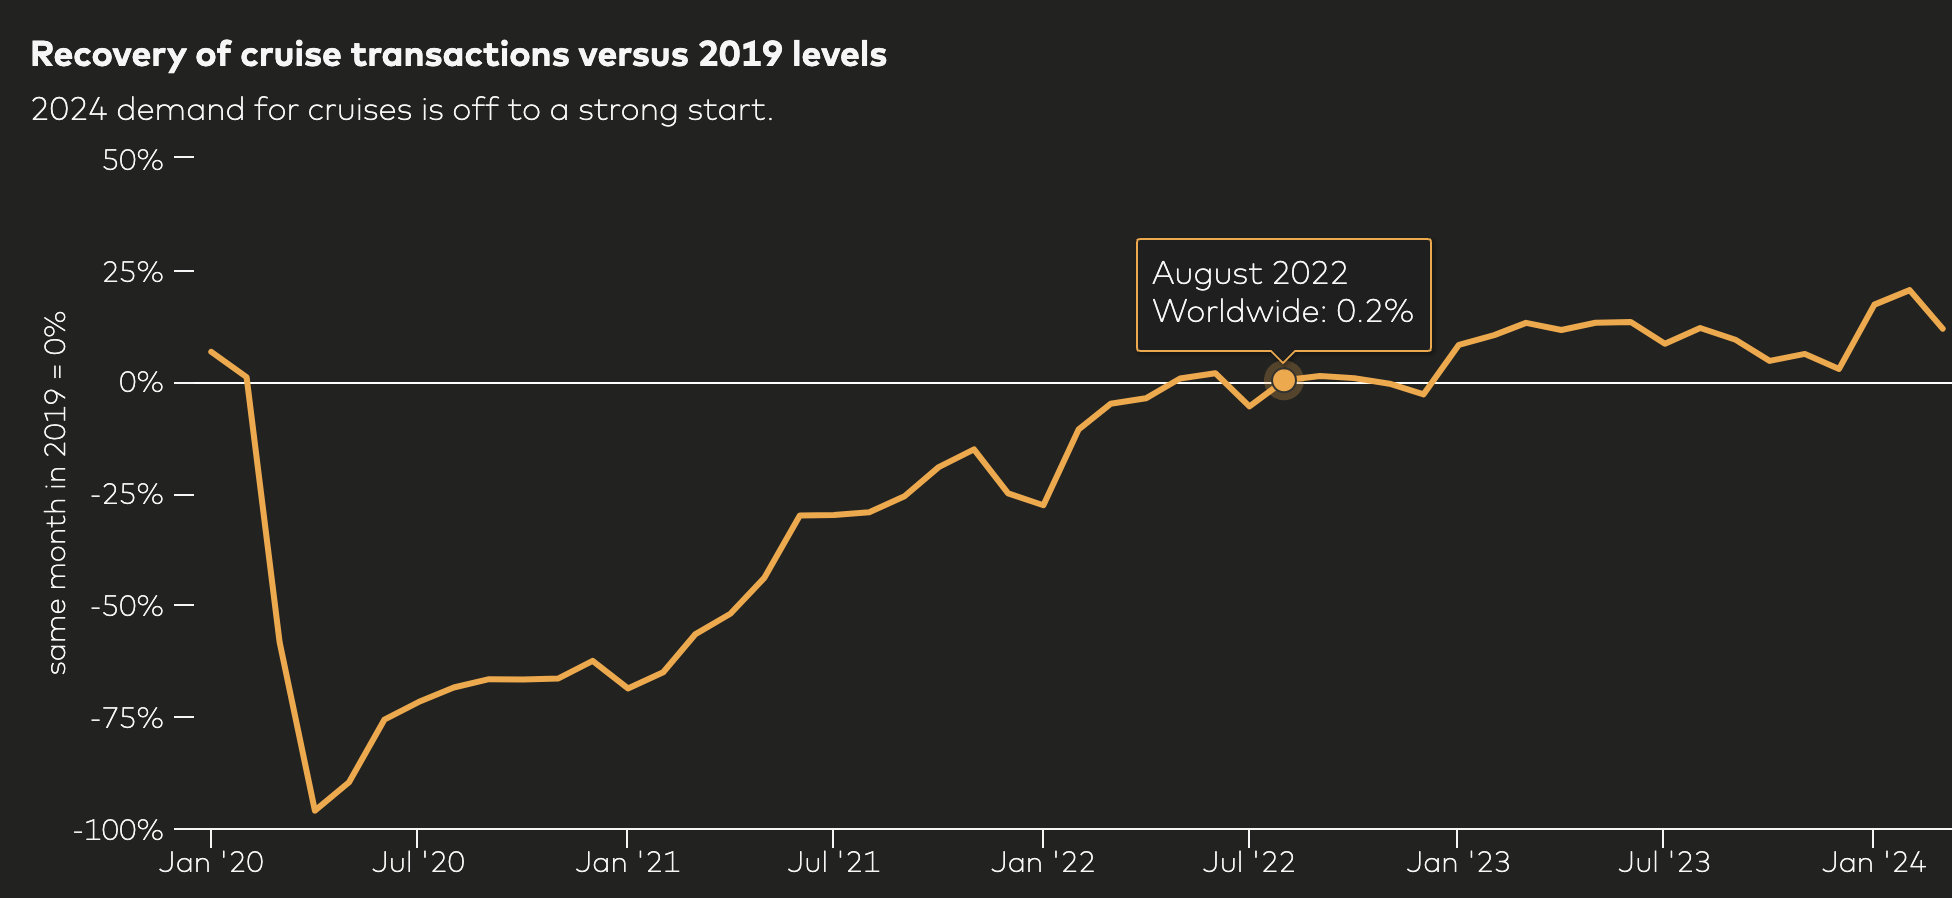
Cruising Full Steam Ahead
Cruises are making a strong comeback with the count of global cruise passenger transactions roughly 16% above 2019 levels in Q1.
The number of transactions made by consumers on cruises (while on-board and for booking) had an impressive start in 2024, comfortably surpassing 2019 levels. Mastercard Economics Institute analysis found that the count of global cruise transactions in Q1 of 2024 is roughly 16% above 2019. As consumers crave new and different experiences, it’s not just travel by air that is growing impressively. 7
Given persistent price increases in the hotel industry, the price difference between cruises and hotels has widened, making trips by cruise a relatively more budget-friendly option in many cases.
Top 10 Global Trending Travel Destinations for Summer 2024 (June through August)
Munich ranks as the number one trending summer destination, followed by Tokyo. But one unexpected destination ranks high, too.
We analyzed flight booking data for the summer season, spanning from June 2024 to August 2024, and calculated each destination’s share of total travel by origin market. By comparing these shares to their typical levels, we identified the top 10 markets by origin that have experienced the most significant gains. These trending destinations have seen the largest increase in their share of flight bookings and signal shifts in traveler preferences. As some markets gain a larger share of bookings, others may experience a relative decrease in share, even if overall passenger traffic increases. 36
According to Mastercard Economics Institute analysis, Munich ranks as the topmost trending global tourist destination from June 2024 through August 2024, with the largest increase in tourism demand heading into the summer, relative to normal levels. Munich will be hosting the opening game of the European Championship in football (soccer) in June.
Tokyo ranks number two on the list, where a historically weak yen and a full year of no restrictions has brought tourists back in waves, higher than historically normal levels. While Japan has already seen an extraordinary inflow of passengers flying into the country, this data suggests the momentum continues to build. Number three on the list may be less expected. Tirana, Albania is a short drive from many coastal hotels and is notably much more wallet-friendly compared to the major tourism hubs in other coastal European countries.
Finally, what do Nice, France; Cancun, Mexico; Bali, Indonesia; Bangkok; Kerkyra, Island of Corfu, Greece; and Aruba have in common? The beach. These areas each rank in the top 10 worldwide trending destinations.

This section focuses on the emerging consumer spending trends playing out while in-destination. We found a collection of interesting themes unraveling globally. For instance, experiential-oriented spend continues to gain importance in the priorities of travelers globally. We also analyze luxury apparel and fine dining versus more casual options and notice interesting patterns playing out worldwide.
SpendingPulse™ Destinations: The experience and nightlife economy keeps growing
Mastercard SpendingPulse TM Destinations provides worldwide estimates of tourism at a high frequency level across all payment types. To get the full dataset, request a demo.
Travelers globally continue to prioritize experiences. Tourists have spent more on nightlife and less on retail shopping, which has recovered at a slower pace. In the sections below, we explore various facets of how travelers spend while in their destination.
Experiences
Spending on experiences and nightlife totals 12% of tourism sales – highest point in at least five years.
The share of total sales attributed to global tourism spending on experiences is 12% as of March 2024, according to SpendingPulse Destinations – the higher than ever before. We analyzed this worldwide share along with spending by tourists departing from Australia, Germany, Chinese Mainland, Italy, U.S. and U.K. Relative to other tourists, Australians tend to spend one of every five dollars on experiences and nightlife – compared to the global average, which is closer to one in every 10 dollars. Demand for experiences has been building from tourists departing from Chinese Mainland. Just a year ago, the share of outbound tourism spend was about 7%, and as of March 2024, the number is about 10%. 38
Luxury apparel shopping in Japan and the United Arab Emirates (UAE) is up 152% and 61% versus last year.
Just as we have seen a bifurcation in where tourists travel to date in 2024, we have also seen a bifurcation in categories where tourists spend. To understand these trends better, the Mastercard Economics Institute segmented tourism spending in the apparel and dining industries based on whether establishments provide a high-end luxury offering or a more casual one. While both the dining and apparel industries benefit from tourists craving new experiences – and looking good in the process – we found that certain markets had much stronger demand for the luxury segment than casual one and vice versa. 40
Based on data to date, destinations in Asia Pacific and other popular luxury destinations, including France, Italy and the U.K., show robust luxury spending growth. In contrast, casual apparel spending growth outperforms in other markets that don’t typically cater to luxury shoppers.
In the UAE, March 2024 tourism shopping for luxury fashion is roughly 61% higher than last year’s levels, gaining in part thanks to the recovery of travel from Asia Pacific.
In the casual apparel segment, markets where tourism apparel spending growth has relatively outperformed in the luxury apparel segment include Thailand, Colombia, and Mexico, which has changed by 69%, 25%, and 14% versus last year, respectively. Luxury apparel shopping in Mexico stands out as a clear example of underperformance, 22% below the same time last year, in part thanks to an exceptionally strong Peso – hitting its highest level relative to the U.S. dollar in 5 years. The Peso’s appreciation appears to have priced some tourists out of Mexico’s luxury retail market for now.
In the dining segment, the picture has been mixed, too, depending on the destination. For instance, tourists traveling to Spain and Brazil favor a more laid-back dining experience with casual dining spending growth outperforming, according to a Mastercard Economics Institute analysis. Meanwhile, a burgeoning fine dining scene in India has translated to marginal outperformance of the fine dining category for in-destination tourism dining.
In Germany, Switzerland, Italy, France, and the U.K., in-destination tourism spending on casual dining is outperforming the fine dining category, highlighting the preferential shift of tourists seeking out budget-friendly choices.
Travelers are staying one extra day, translating to an extra boost for destinations.
Globally, Mastercard Economics Institute analysis suggests leisure travelers are enjoying longer trips – by about an extra day. For the 12 months between March 2019 and February 2020, a trip’s average length of stay was just about four days. As of March 2024, the length of a leisure trip globally is close to five days. 40
These longer stays carry a range of important implications. For instance, longer stays generally translate to more spend per trip. This increase in the number of days translates to a greater economic boost for businesses supporting local economies in the travel industry. For markets such as Thailand, where dependence on tourism is extremely high, these extra days make a significant difference.
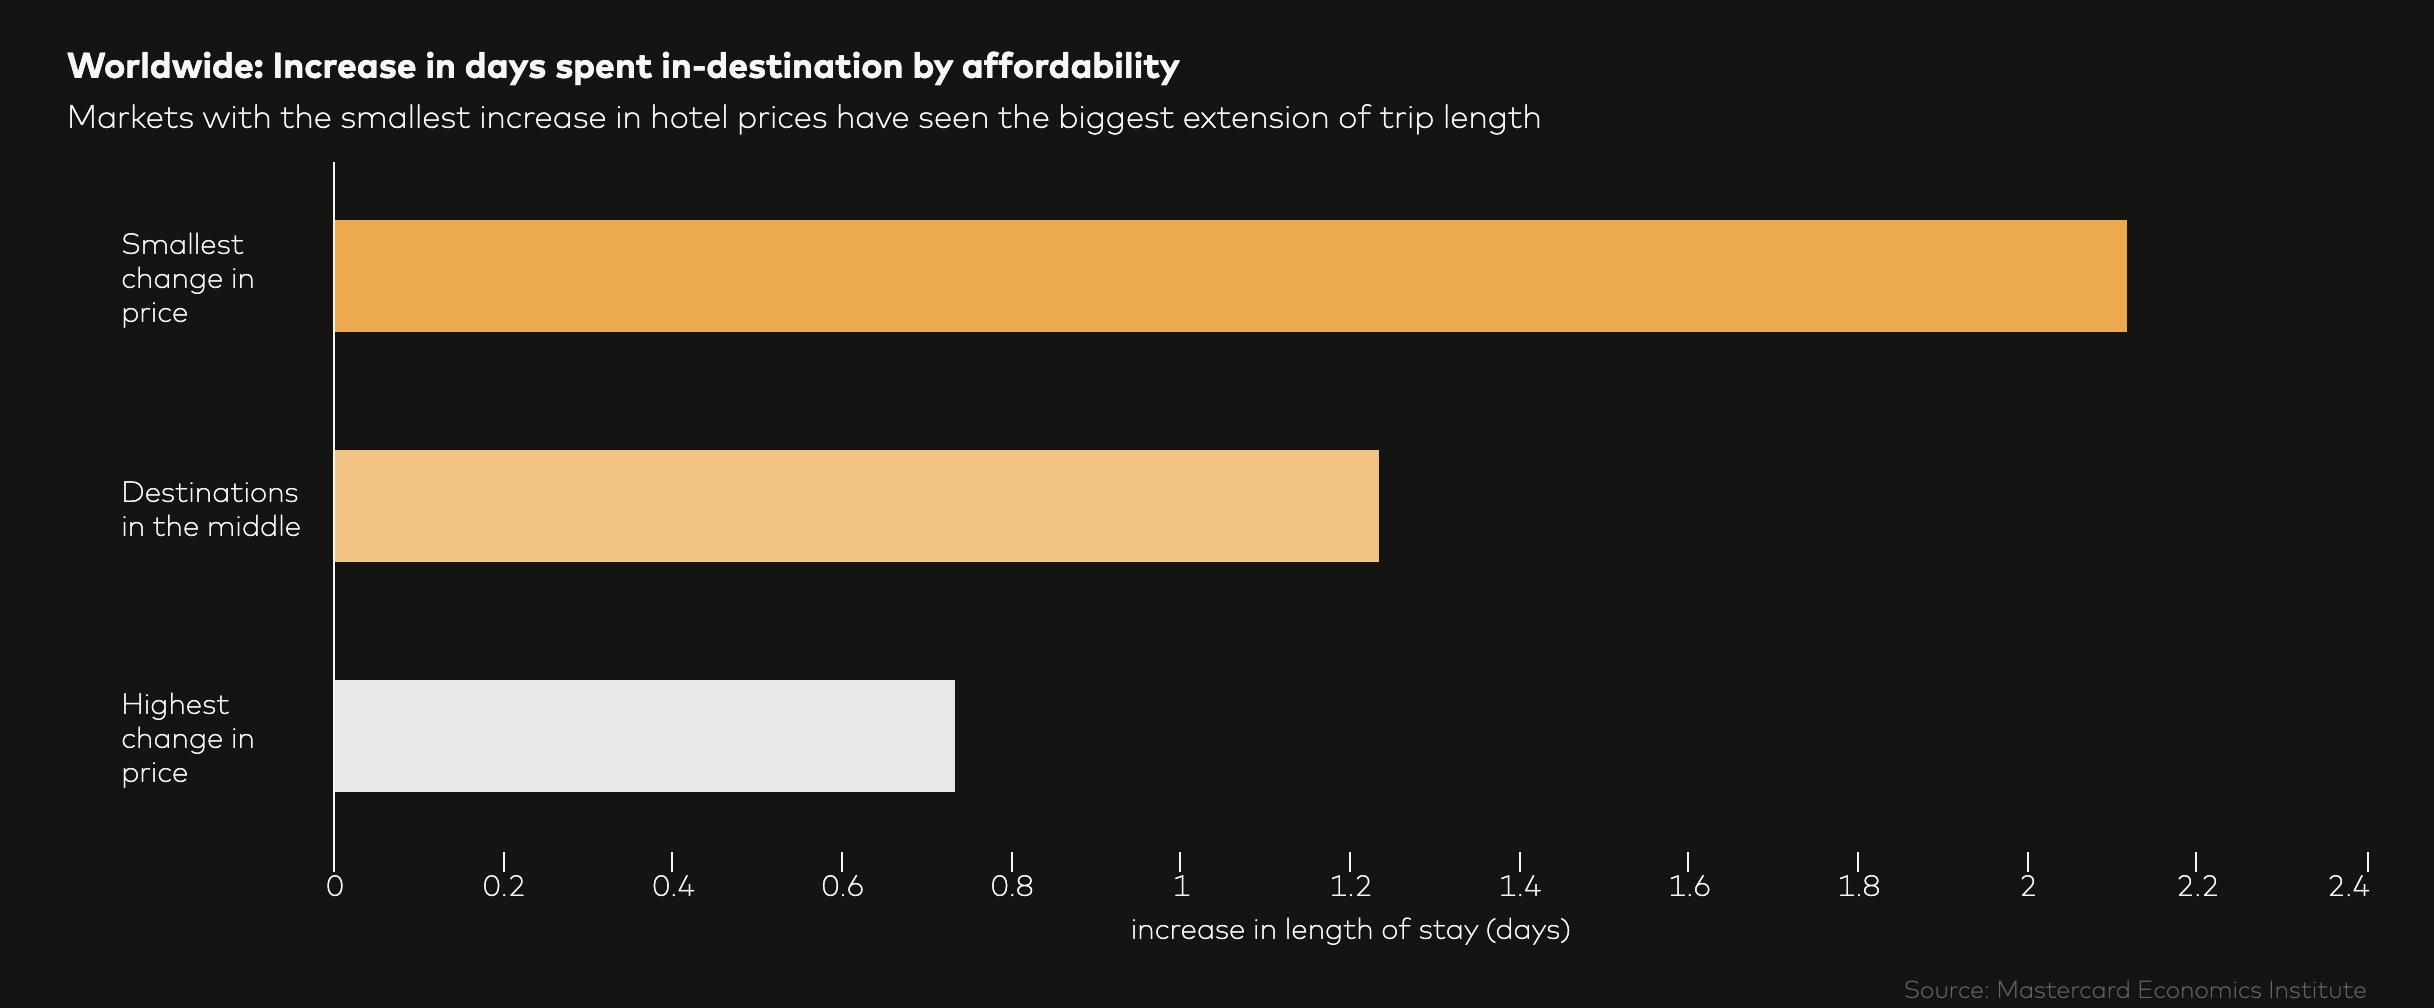
Affordability of the destination
We compared the change in prices at hotels paid by tourists in over 100 destinations at hotels and how much longer tourists spend while in those destinations. We found a clear inverse relationship between the price of the destination and the incremental number of days tourists spend while in those destinations. In other words, the cheaper the destination, the longer the stay.
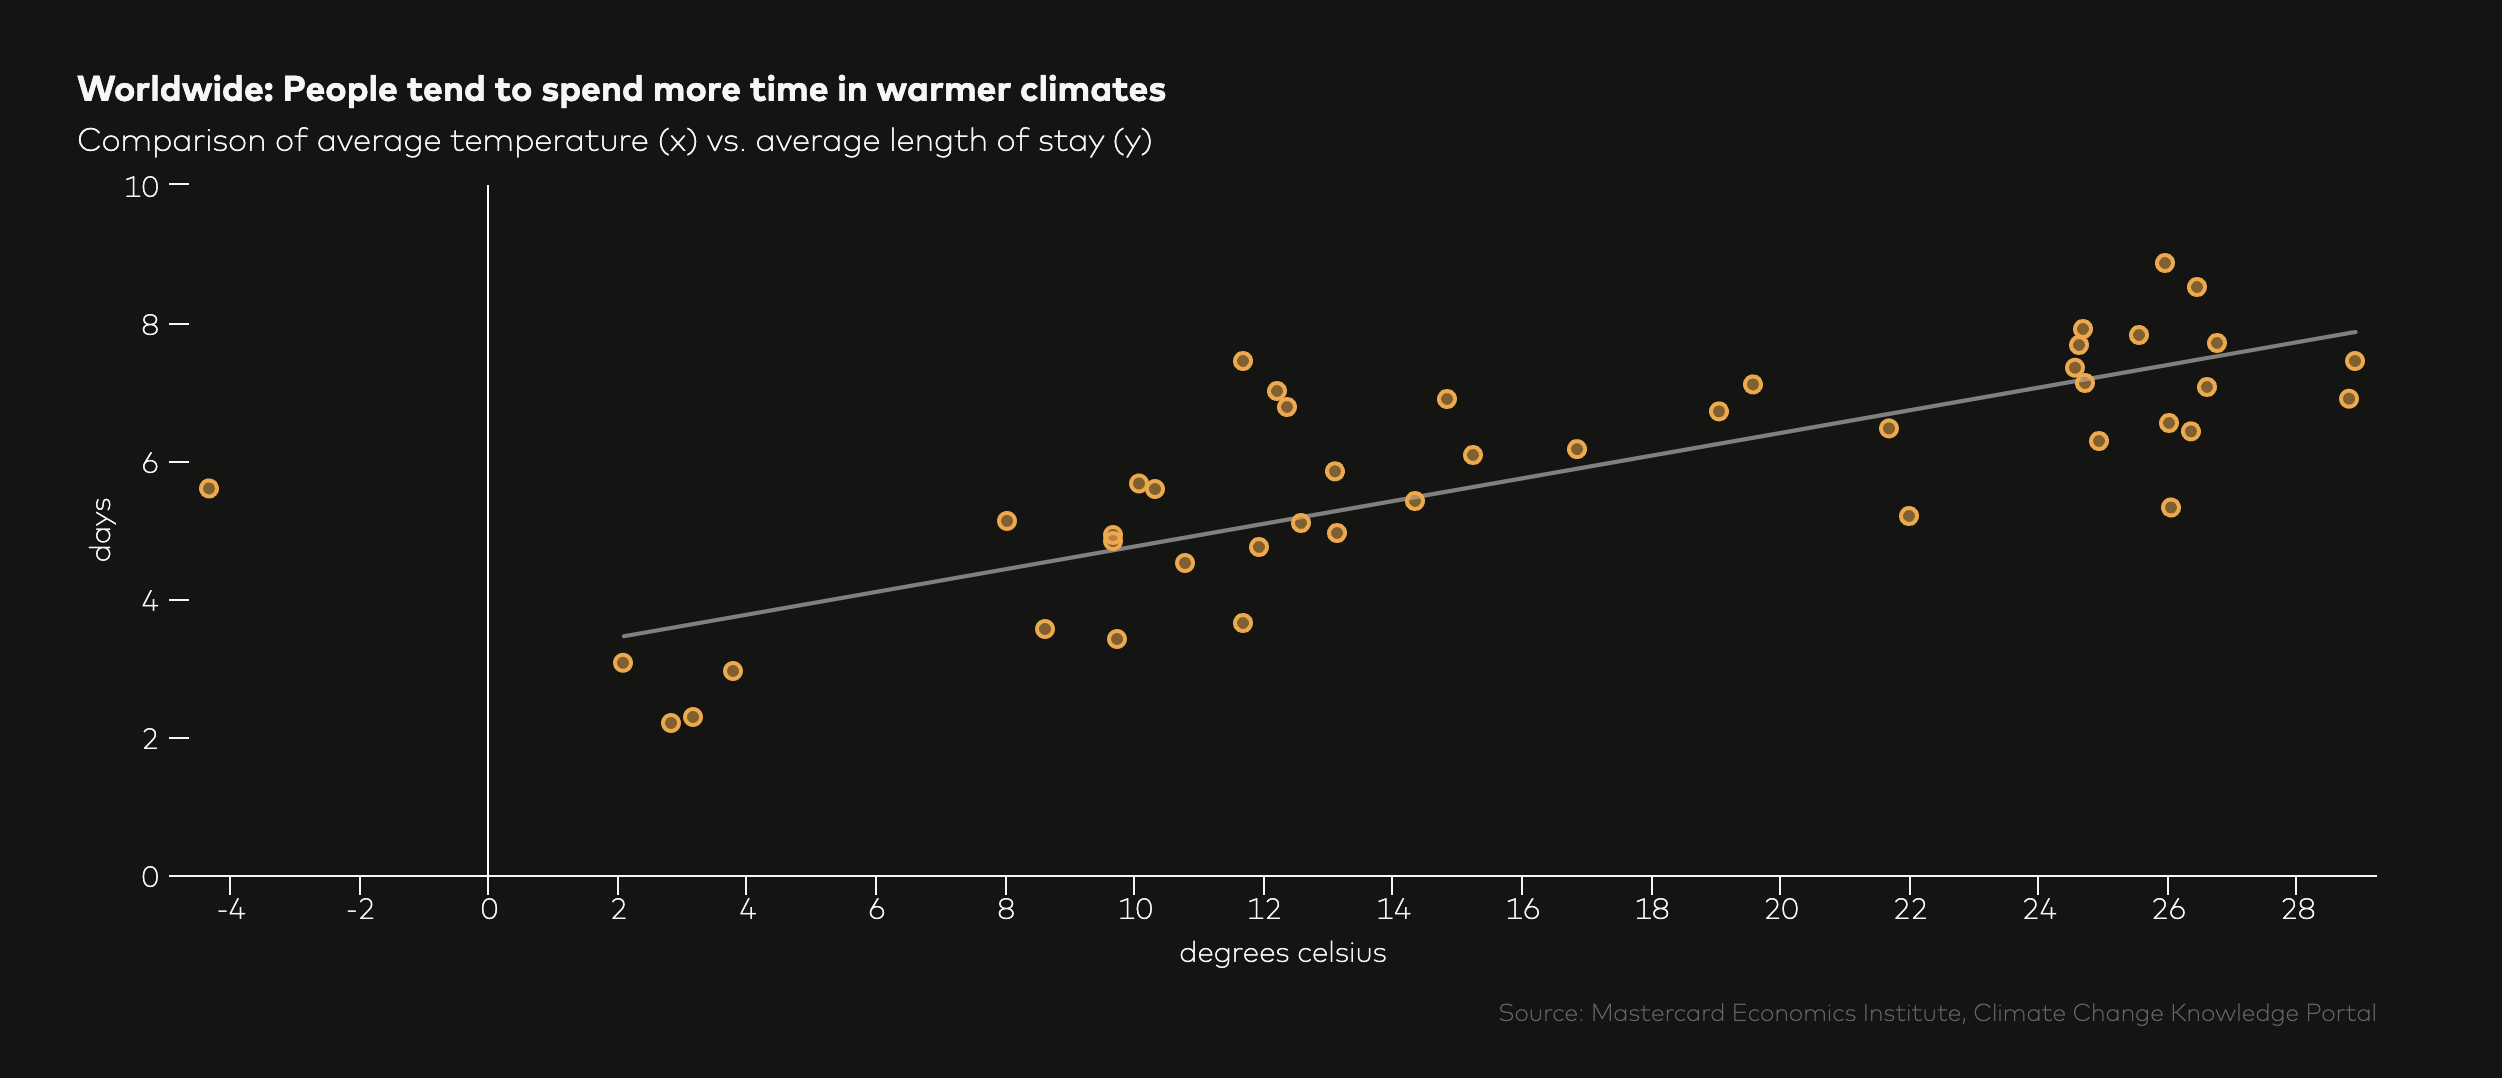
Enjoyable climates
Generally, the warmer the destination, the more time consumers tend to spend in the destination. The scatterplot below shows the average temperature within a country and the average length of a trip in that destination. For each extra 6 degrees Celsius of the temperature, the estimated change in length of stay is approximately one day. It’s worth noting that this isn’t completely linear. For instance, popular (and cooler) ski destinations buck this trend, and when temperatures get too hot, the length of stay drops moderately.
Boundaries are made to be broken, and tourists have been doing just that by spending in the sector in record numbers around the world. Whether it’s cruise ship bookings or top destinations offering great value and unforgettable experiences, the appetite for travel continues to grow. But today’s traveler isn’t indiscriminately traveling. Tourists today are savvy enough to know where to go to stretch their funds and enjoy a longer stay whenever possible. As 2024 continues, we’ll be watching how, where and when consumers travel and what it means for the destination countries. Until then, Bon Voyage!
Footnotes
1 Mastercard Economics Institute analysis of aggregated & anonymized switched consumer volumes (nominal US dollars unadjusted for FX) through March 2024.
2 Mastercard Economics Institute analysis, US ITA, Japan National Tourism Organization
3 Mastercard Economics Institute analysis of aggregated & anonymized switched consumer volumes (nominal US dollars unadjusted for FX) through March 2024.
4 Mastercard Economics Institute analysis of aggregated & anonymized flight booking data of leisure travel provided by third party partners.
5 Analysis in the subsequent bullets based on Mastercard Economics Institute estimates of incremental sales boost of aggregated & anonymized leisure related volumes during events (nominal US dollars unadjusted for FX).
6 Mastercard Economics Institute analysis of official consumer price index (CPI) and personal consumption expenditure (PCE) price index data.
7 Mastercard Economics Institute analysis of aggregated & anonymized switched consumer transactions made throughout the cruise industry.
8 Mastercard Economics Institute Analysis of Airports Authority of India passenger traffic data.
9 Mastercard Economics Institute estimates of demographic trends across India.
10 Mastercard Economics Institute analysis of passenger arrival data in Vietnam, United States and Japan, sourced from U.S. NTTO, Japan National Tourism Organization and Vietnam General Statistics Office
11 Mastercard Economics Institute analysis of aggregated & anonymized leisure flight booking data provided by third party partners through the end of March 2024.
12 Mastercard Economics Institute Analysis of Thailand Department of Tourism visitor arrival data through the end of February 2024.
13 Mastercard Economics Institute Analysis of Japan National Tourism Organization visitor arrival data through the end of March 2024.
14 Mastercard Economics Institute Analysis of Japan National Tourism Organization visitor arrival data through the end of March 2024.
15 Mastercard Economics Institute Analysis of Japan National Tourism Organization visitor arrival data through the end of March 2024.
16 Mastercard Economics Institute Analysis of Japan National Tourism Organization visitor arrival data through the end of March 2024.
17 Mastercard Economics Institute analysis of Civil Aviation Administration of China (CAAC) market-wide passenger traffic through the end of March 2024.
18 Mastercard Economics Institute analysis of Civil Aviation Administration of China (CAAC) market-wide passenger traffic through the end of March 2024.
19 Mastercard Economics Institute analysis of Civil Aviation Administration of China (CAAC) market-wide passenger traffic through the end of March 2024.
20 Mastercard Economics Institute analysis of U.S. ITA data measuring aggregate passenger traffic abroad through the end of March 2024.
21 Mastercard Economics Institute analysis of Conference Board survey of consumer attitudes through April 2024.
22 Mastercard Economics Institute analysis of U.S. NTTA passenger arrivals through the end of March 2024.
23 Mastercard Economics Institute analysis of aggregated & anonymized switched leisure travel related transactions (nominal US dollars unadjusted for FX).
24 Mastercard Economics Institute analysis of aggregated & anonymized switched leisure travel related transactions (nominal US dollars unadjusted for FX)
25 Mastercard Economics Institute Analysis of Japan National Tourism Organization visitor arrival data through the end of March 2024.
26 Mastercard Economics Institute analysis of official data from Eurostat.
27 Mastercard Economics Institute analysis of Eurocontrol flight traffic data.
28 Mastercard Economics Institute analysis of official data from Eurostat.
29 Mastercard Economics Institute analysis of official data from Eurostat.
30 Mastercard Economics Institute analysis of official data from Eurostat.
31 Mastercard Economics Institute analysis of aggregated & anonymized switched leisure travel related hotel volumes (nominal US dollars unadjusted for FX). “Relatively more affordable” and “relatively more expensive” defined by proprietary clustering algorithm.
32 Mastercard Economics Institute analysis of aggregated & anonymized switched leisure travel related volumes (nominal US dollars unadjusted for FX). “Relatively more affordable” and “relatively more expensive” defined by proprietary clustering algorithm.
33 Mastercard Economics Institute analysis of visitor arrival data from the Department of Statistics of Bahamas
34 Mastercard Economics Institute analysis of aggregated & anonymized switched leisure travel related transactions normalized to growth in the number of active accounts.
35 Mastercard Economics Institute analysis of aggregated & anonymized switched leisure travel related transactions normalized to growth in the number of active accounts.
36 Mastercard Economics Institute analysis of aggregated & anonymized switched leisure travel related volumes (nominal US dollars unadjusted for FX).
37 Mastercard Economics Institute analysis of aggregated & anonymized leisure flight booking data provided by third party partners. Analysis focused on incremental change in share above normal for future departure dates between June 2024 through August 2024. Reflects estimates as of April 15th, 2024. Share gains subject to change as not all flights have been booked for the summer period.
38 Mastercard Economics Institute analysis of aggregated & anonymized Mastercard leisure travel related switched transactions
39 Mastercard Economics Institute analysis of SpendingPulse Destinations ending March 2024.
40 Mastercard Economics Institute analysis of aggregated & anonymized Mastercard switched consumer travel related volumes (nominal US dollars unadjusted for FX). Analysis focuses on a sample of apparel retailers and restaurants providing a “casual” or “luxury” experience measured by average price point paid by consumers.
41 Mastercard Economics Institute analysis of aggregated & anonymized flight booking data provided by third-party partners.
About the Mastercard Economics Institute
Mastercard Economics Institute launched in 2020 to analyze macroeconomic trends through the lens of the consumer. A team of economists, analysts and data scientists draws on Mastercard insights — including Mastercard SpendingPulse™ — and third-party data to deliver regular reporting on economic issues for key customers, partners and policymakers.
Disclaimer
© 2024 Mastercard International Incorporated. All rights reserved.
This Mastercard Economics Institute presentation (This “Presentation”) and content or portions thereof may not be accessed, downloaded, copied, modified, distributed, used or published in any form or media, except as authorized by Mastercard. This presentation and content are intended solely as a research tool for informational purposes and not as investment advice or recommendations for any particular action or investment and should not be relied upon, in whole or in part, as the basis for decision-making or investment purposes. This presentation and content are not guaranteed as to accuracy and are provided on an “as is” basis to authorized users, who review and use this information at their own risk. This presentation and content, including estimated economic forecasts, simulations or scenarios from the Mastercard Economics Institute, do not in any way reflect expectations for (or actual) Mastercard operational or financial performance.
Disclaimer: Press release
© Press Release 2025
Send us your press releases to news@globalloyalty.org
Press releases originate from external third-party providers. This website does not have responsibility or control over its content, which is presented as is, without any alterations. Neither this website nor its affiliates guarantee the accuracy of the views or opinions expressed in the press release.
The press release is intended solely for informational purposes and does not offer tax, legal, or investment advice, nor does it express any opinion regarding the suitability, value, or profitability of specific securities, portfolios, or investment strategies. Neither this website nor its affiliates are liable for any errors or inaccuracies in the content, nor for any actions taken based on it. By using the information provided in this article, you agree to do so at your own risk.
To the maximum extent permitted by applicable law, this website, its parent company, subsidiaries, affiliates, shareholders, directors, officers, employees, agents, advertisers, content providers, and licensors shall not be liable to you for any direct, indirect, consequential, special, incidental, punitive, or exemplary damages, including but not limited to lost profits, savings, and revenues, whether in negligence, tort, contract, or any other theory of liability, even if the possibility of such damages was known or foreseeable.
The images used in press releases and articles provided by 3rd party sources belong to the respective source provider and are used for illustrative purposes in accordance with the original press releases and publications.
Disclaimer: Content
While we strive to maintain accurate and up-to-date content, Global Loyalty Organisation Ltd. makes no representations or warranties of any kind, express or implied, about the correctness accuracy, completeness, adequacy, or reliability of the information or the results derived from its use, not that the content will meet your requirements or expectations. The content is provided “as is” and “as available”. You agree that your use of the content is at your own risk. Global Loyalty Organisation Ltd. disclaims all warranties related to the content, including implied warranties of merchantability, fitness for a particular purpose, non-infringement, and title, and is not liable for a particular purpose, non-infringement, and title, and is not liable for any interruptions. Some jurisdictions do not allow the exclusion of certain warranties, so these jurisdictions may not apply to you. Global Loyalty Organisation Ltd. Reserves the right to modify, interrupt, or discontinue the content without notice and is not liable for doing so.
Global Loyalty Organisation Ltd. shall not be liable for any damages, including special, indirect, consequential, or incidental damages, or damages for lost profits, revenue, or use, arising out of or related to the content, whether in contract, negligence, tort, statute, equity, law, or otherwise, even if advised of such damages. Some jurisdictions do not allow limitations on liability for incidental or consequential damages, so this limitation may not apply to you. These disclaimers and limitations apply to Global Loyalty Organisation Ltd. and its parent, affiliates, related companies, contractors, sponsors, and their respective directors, officers, members, employees, agents, content providers, licensors, and advisors.
The content and its compilation, created by Global Loyalty Organisation Ltd, are the property of Global Loyalty Organisation Ltd. and cannot be reproduced without prior written permission.
